 Contact
A Strong Case for Active Management in International Small Caps
June 23, 2023


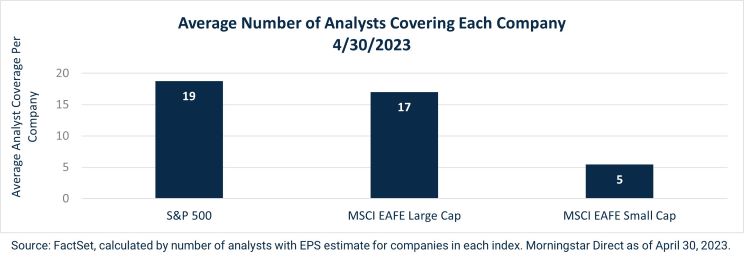
International markets have long been an arena that poses more intricate questions and provides less straight forward answers to investors. Aside from the systematic risks seen across all investments, companies beyond our borders are met with a myriad of other exposures, including foreign exchange, tax, and macroeconomic/political risks to name a few. One could argue that all of these factors in motion can blend together to create a single yet distinct feeling – uncertainty. The feeling is only further compounded in the international small cap space, as its vast universe of over 2,200 developed market companies (as defined by the MSCI EAFE Small Cap Index) exhibits relatively low analyst coverage when compared to large cap indices.
While this lack of coverage may steer some away from the asset class, we actually see this as an opportunity for strong active managers to add value in a less efficient market where thin analyst coverage and less timely, reliable information may manifest in more frequent and short-term price deviations. For example, the chart below outlines that average excess returns delivered by a top quartile (25th percentile) active manager on a rolling 12-month basis have been 4.16% since 2001.
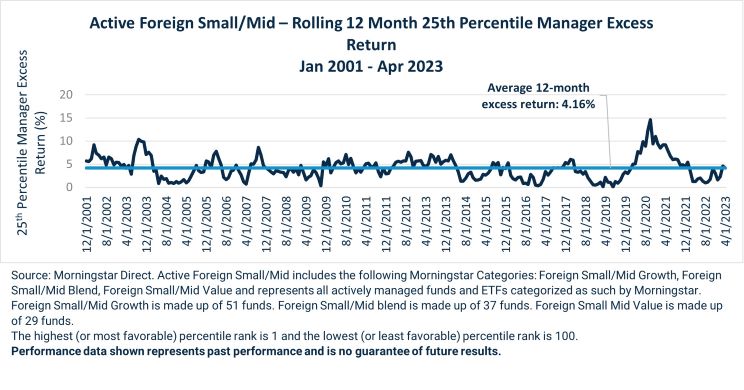
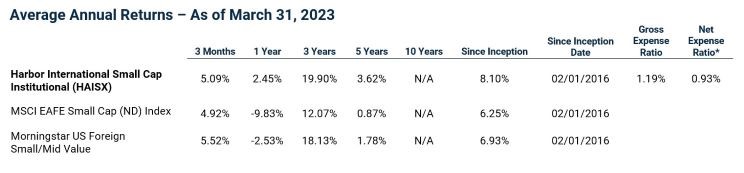
Keeping the two preceding ideas at the forefront, the bell for active management starts to ring louder for international small caps. But as the previous chart denotes, managers may need to demonstrate expertise within this arena to potentially see these excess returns. It is our view that Cedar Street Asset Management displays the prowess needed to generate strong, risk-adjusted returns. Since assuming management of the Harbor International Small Cap Fund in May of 2019, the Institutional Share Class (Ticker: HAISX) has returned net 8.04% annualized versus 3.96% for MSCI EAFE Small Cap.
*The Advisor has contractually agreed to limit the Fund’s operating expenses, excluding interest expense (if any), to 0.85%, 0.93%, 1.18%, and 1.29% for the Retirement Class, Institutional Class, Administrative Class, and Investor Class, respectively, through May 31, 2024. Only the Fund’s Board of Trustees may modify or terminate this agreement.
Performance data shown represents past performance and is no guarantee of future results. Past performance is net of management fees and expenses and reflects reinvested dividends and distributions. Past performance reflects the beneficial effect of any expense waivers or reimbursements, without which returns would have been lower. Investment returns and principal value will fluctuate and when redeemed may be worth more or less than their original cost. Returns for periods less than one year are not annualized. Current performance may be higher or lower and is available through the most recent month end at harborcapital.com or by calling 800-422-1050. For the Fund's most current performance click here.
While non-U.S. markets can present additional challenges for investors, we believe that Cedar Street’s exclusive focus on international small cap investing has the potential to simplify the landscape and create opportunities to generate alpha. To learn more about Harbor and Cedar Street’s partnership, take a look at Harbor’s International Small Cap Product Page.
Important Information
There is no guarantee that the investment objective of the Fund will be achieved. Stock markets are volatile and equity values can decline significantly in response to adverse issuer, political, regulatory, market and economic conditions. Investing in international and emerging markets poses special risks, including potentially greater price volatility due to social, political and economic factors, as well as currency exchange rate fluctuations. These risks are more severe for securities of issuers in emerging market regions. Stocks of small cap companies pose special risks, including possible illiquidity and greater price volatility than stocks of larger, more established companies.
Foreign exchange risk is the chance that a company will lose money on international trade because of currency fluctuations. Tax risk is the uncertainty associated with a country’s tax laws that may potentially affect the rate of return generated by an investment. Political risk is the risk that the political and economic climate of a country will negatively affect an investment.
The S&P 500 Index is an unmanaged index generally representative of the U.S. market for large capitalization equities. The MSCI EAFE Large Cap Index is an equity index which captures large cap representation across developed markets countries around the world, excluding the US and Canada. With 335 constituents, the index covers approximately 70% of the free float- adjusted market capitalization in each country. The MSCI EAFE Small Cap Index is an equity index which captures small cap representation across developed markets countries around the world, excluding the US and Canada. These unmanaged indices do not reflect fees and expenses and are not available for direct investment.
Morningstar Foreign Small/Mid-value portfolios invest in international stocks that are smaller and less expensive than other stocks. These portfolios primarily invest in stocks that fall in the bottom 30% of each economically integrated market (such as Europe or Asia ex-Japan). Value is defined based on low valuations (low price ratios and high dividend yields) and slow growth (low growth rates for earnings, sales, book value, and cash flow). These portfolios typically will have less than 20% of assets invested in U.S. stocks.
This material may reference countries which may be generally the subject of selective sanctions programs administered. Readers of this commentary are solely responsible for ensuring that their investment activities in relation to any sanctioned country are carried out in compliance with applicable laws, rules or policies.
In relation to any data attributed to Morningstar, please note the following: © Morningstar 2023. All rights reserved. Use of this content requires expert knowledge. It is to be used by specialist institutions only. The information contained herein: (1) is proprietary to Morningstar and/or its content providers; (2) may not be copied, adapted or distributed; and (3) is not warranted to be accurate, complete or timely. Neither Morningstar nor its content providers are responsible for any damages or losses arising from any use of this information, except where such damages or losses cannot be limited or excluded by law in your jurisdiction. Past financial performance is no guarantee of future results.
Alpha is a measure of risk (beta)-adjusted return.
Earnings per share (EPS) is the portion of a company's profit allocated to each outstanding share.
The views expressed herein may not be reflective of current opinions, are subject to change without prior notice, and should not be considered investment advice.
2968724


