 Contact
Active Edge
Small Caps: A Six-Month Check-In – Progress or Setback?
February 20, 2025


Looking Ahead, What Does The Opportunity Set For Small Caps Look Like?
As of January 31, 2025
With the beginning of a new administration and prospects for major changes on the horizon, we may be tempted to only look ahead for what might come next for markets.
At Harbor, we certainly like to offer outlooks on prospective trends, but we also want to harness the past to give us insights for the future. Given this philosophy, we have revisited our thoughts on small cap stocks with up-to-date data since we last published our Small Cap Active Edge report. We also offer perspective on what to watch for amid a potential shift in fundamentals, a unified GOP government, and possible index concentration fluctuations. Even as change is inevitable, we remain steadfast in our belief that active management can help investors navigate an increasingly complex and evolving investment landscape. Here are six pressing questions as we look both backward and forward:
Questions for consideration:
- How have small cap stocks performed since our last report?
- Looking forward, what do fundamentals suggest about the opportunity set for small cap stocks?
- How could small cap fundamentals actually influence future returns?
- The GOP is now in control of the White House and both branches of Congress. How have markets historically performed in similar regimes, and how does that compare to other regime cycles?
- How should you think about investing during periods of rising and falling S&P 500 Index concentration?
- Should you consider an active or passive approach to your small cap portfolio allocation?
Q: How have small cap stocks performed since our last report?
A: From April 2024 through November 2024, small caps experienced a strong seven-month rally that outpaced large caps. However, their comeback was stalled by a December selloff, fueled by investors resetting 2025 interest rate expectations. While small caps (represented by the Russell 2000 Index) still produced a double-digit return in 2024, they ultimately lagged large caps (represented by the S&P 500 Index) by -13% through December.
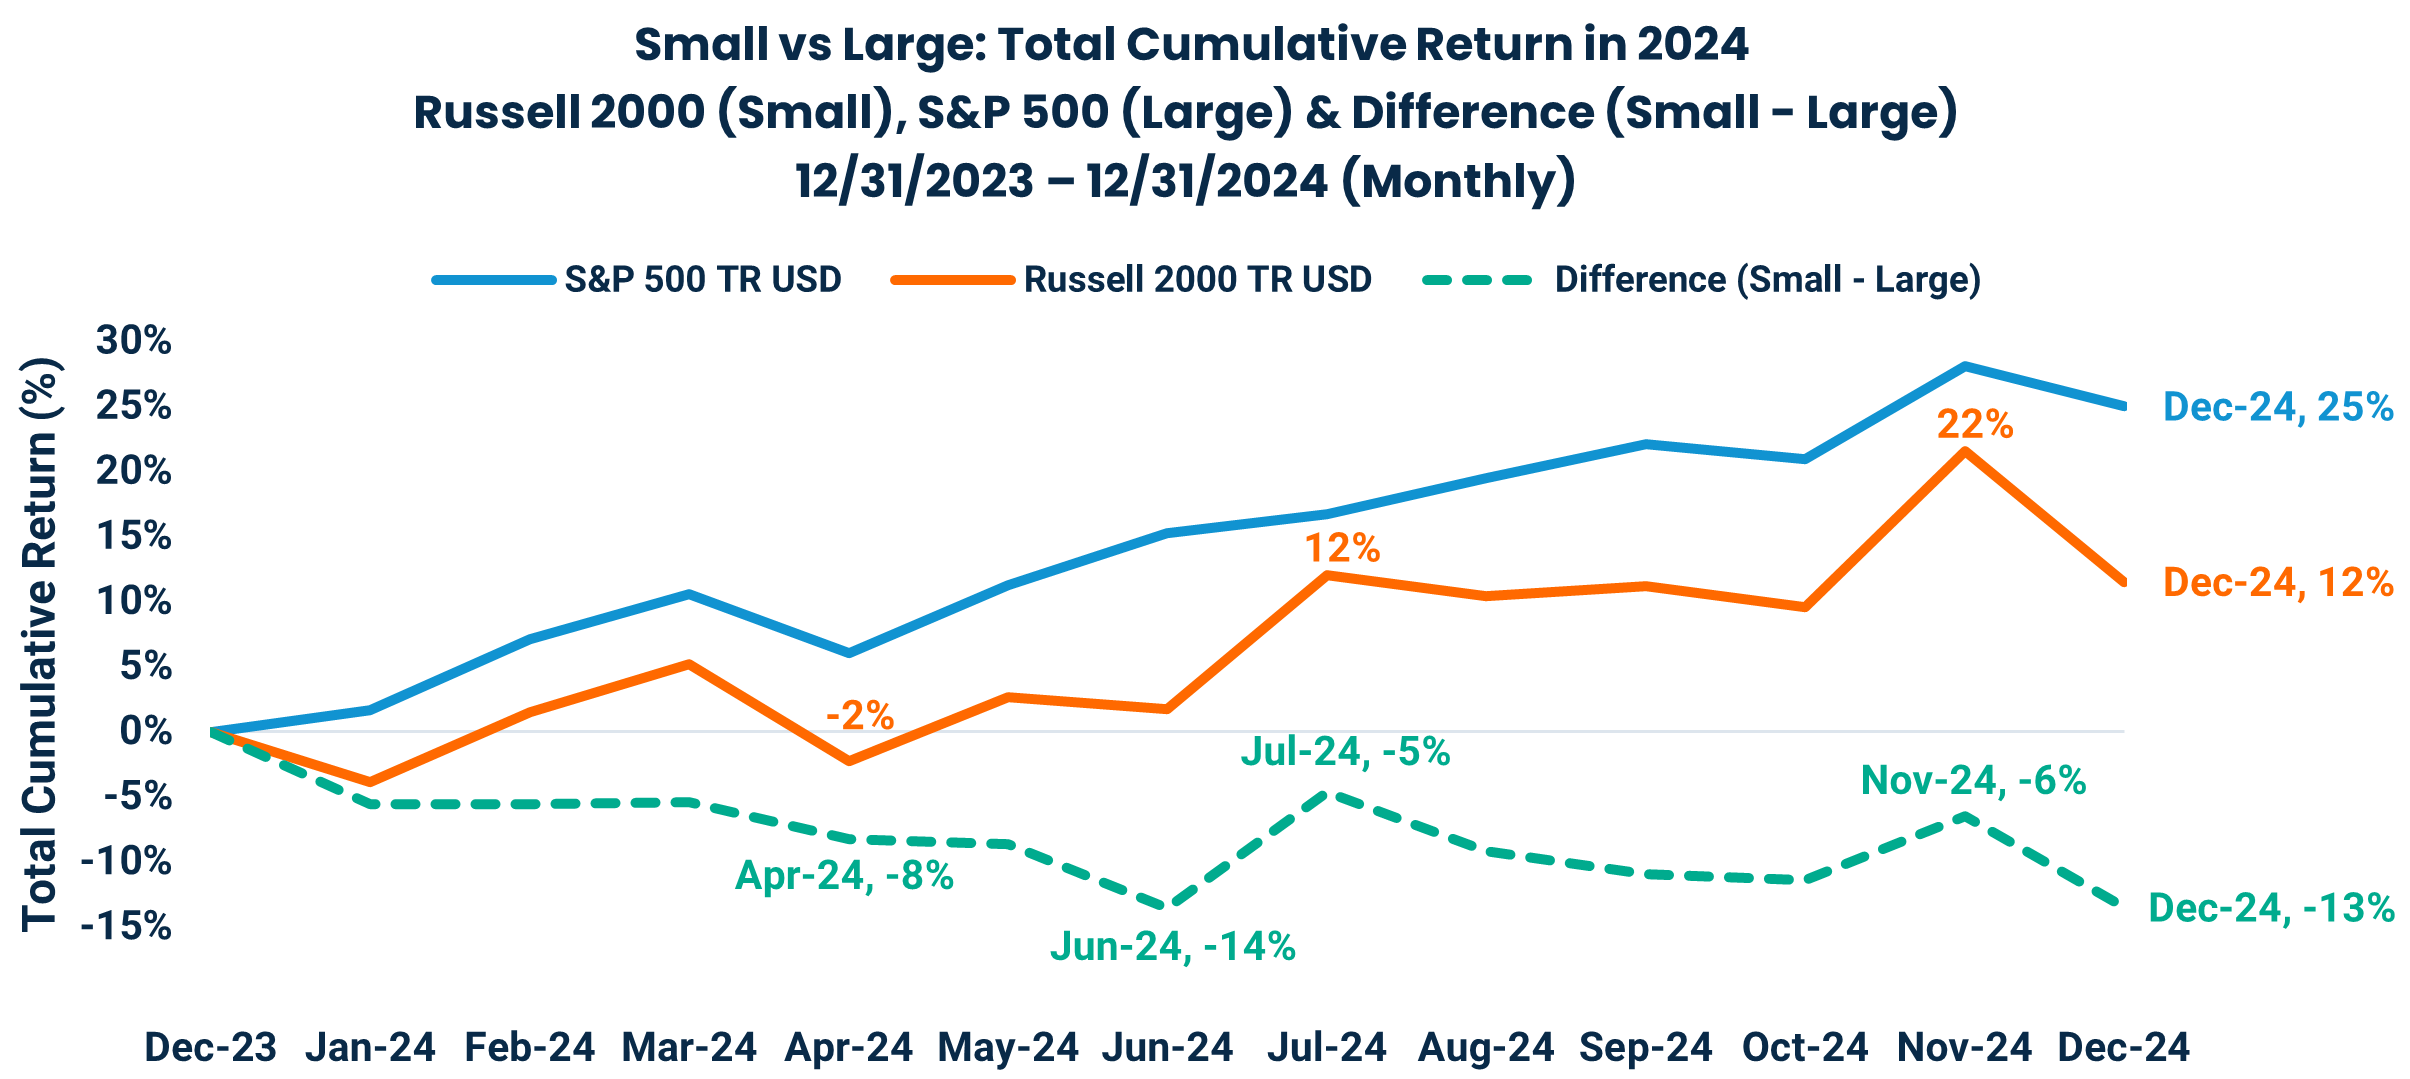
Source: Morningstar Direct; Russell 2000 TR USD & RS&P 500 TR USD monthly, total returns (12/31/2023 – 12/31/2024). Performance data shown represents past performance and is no guarantee of future results.
The good news is that the quick reversal from under- to outperforming between May 2024 and November 2024 was strong enough for the Russell 2000 to finally recover its 2021 loss, representing its third-longest drawdown period since 1984.
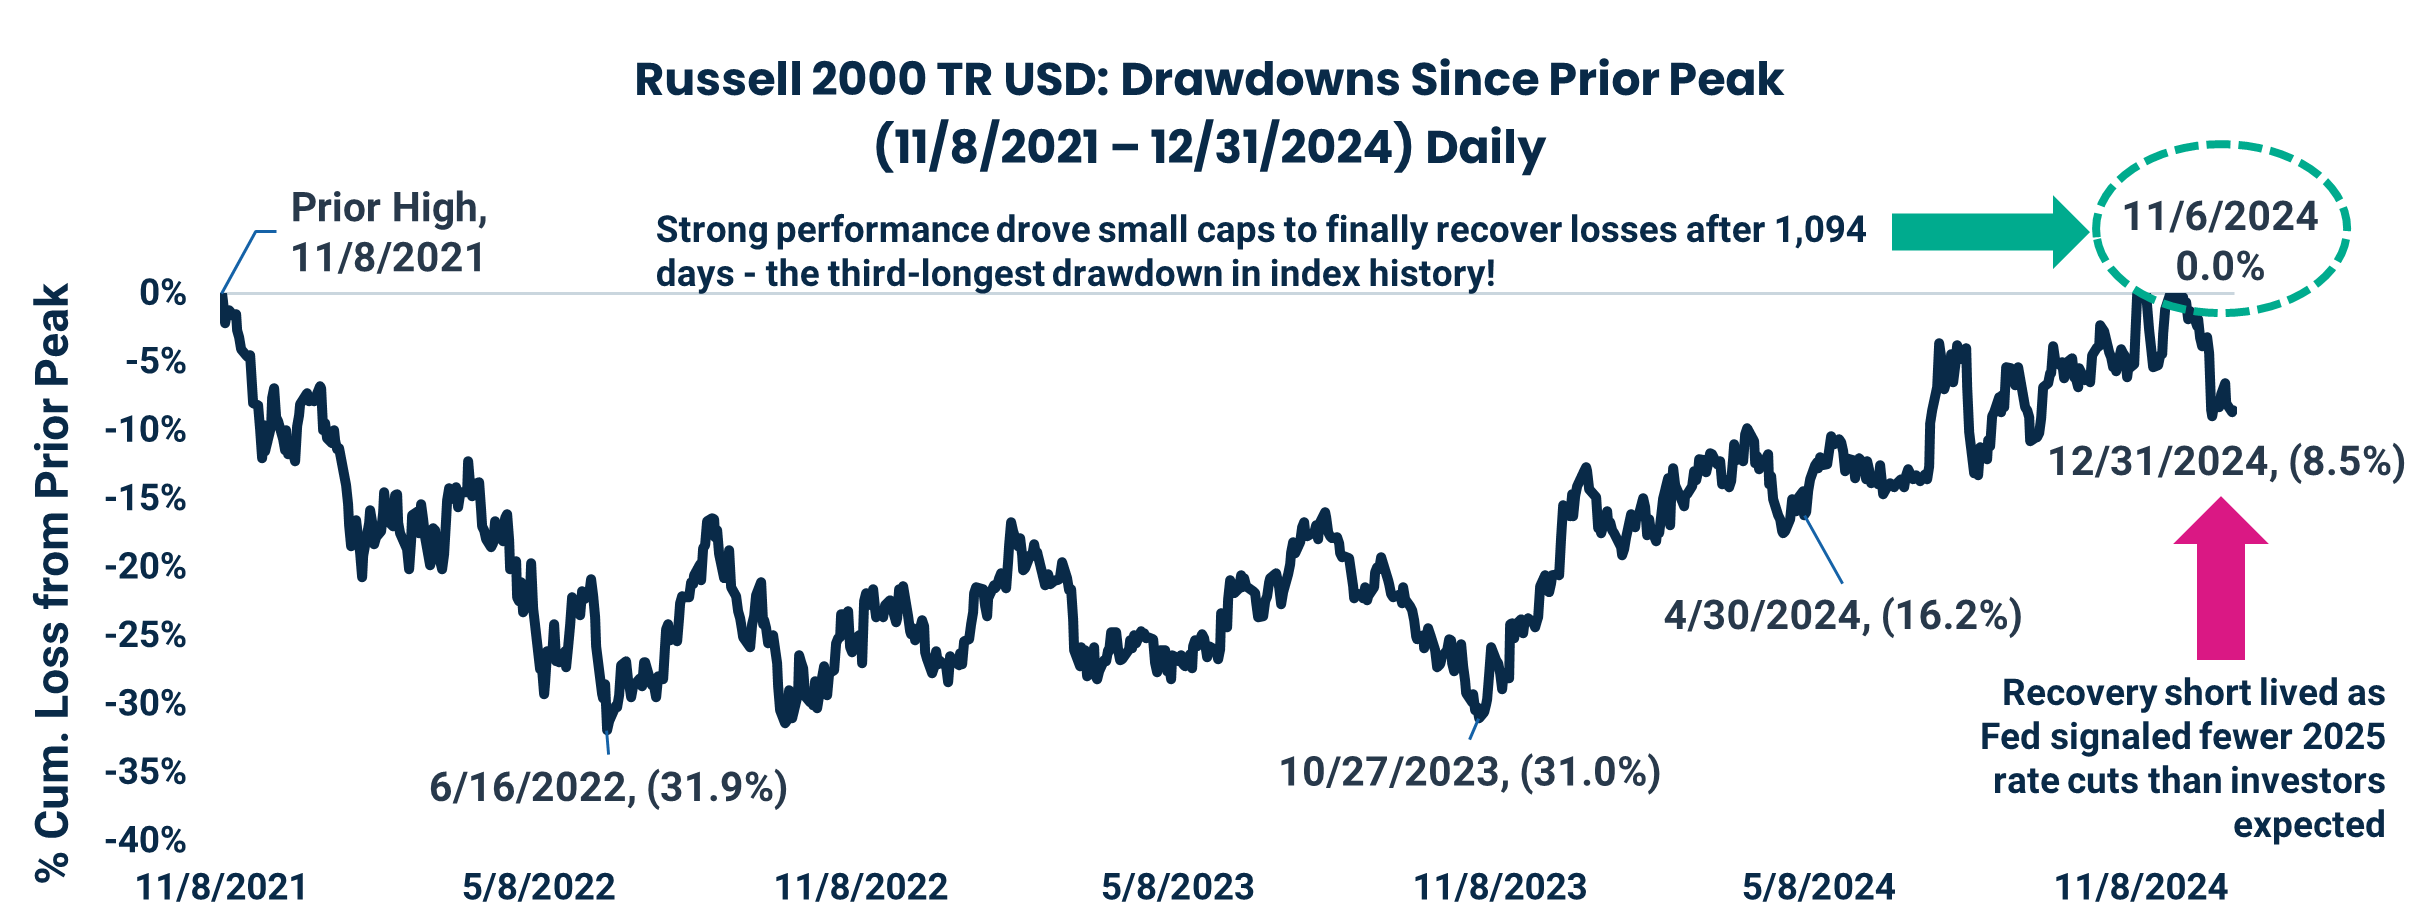
Source: Morningstar Direct; Russell 2000 TR USD daily, total returns. Performance data shown represents past performance and is no guarantee of future results.
The bad news? The rally wasn’t strong, or long, enough to outpace large caps in 2024. The Russell 2000 underperformed the S&P 500 by -13% this past year, continuing the trailing trend into its fourth year.
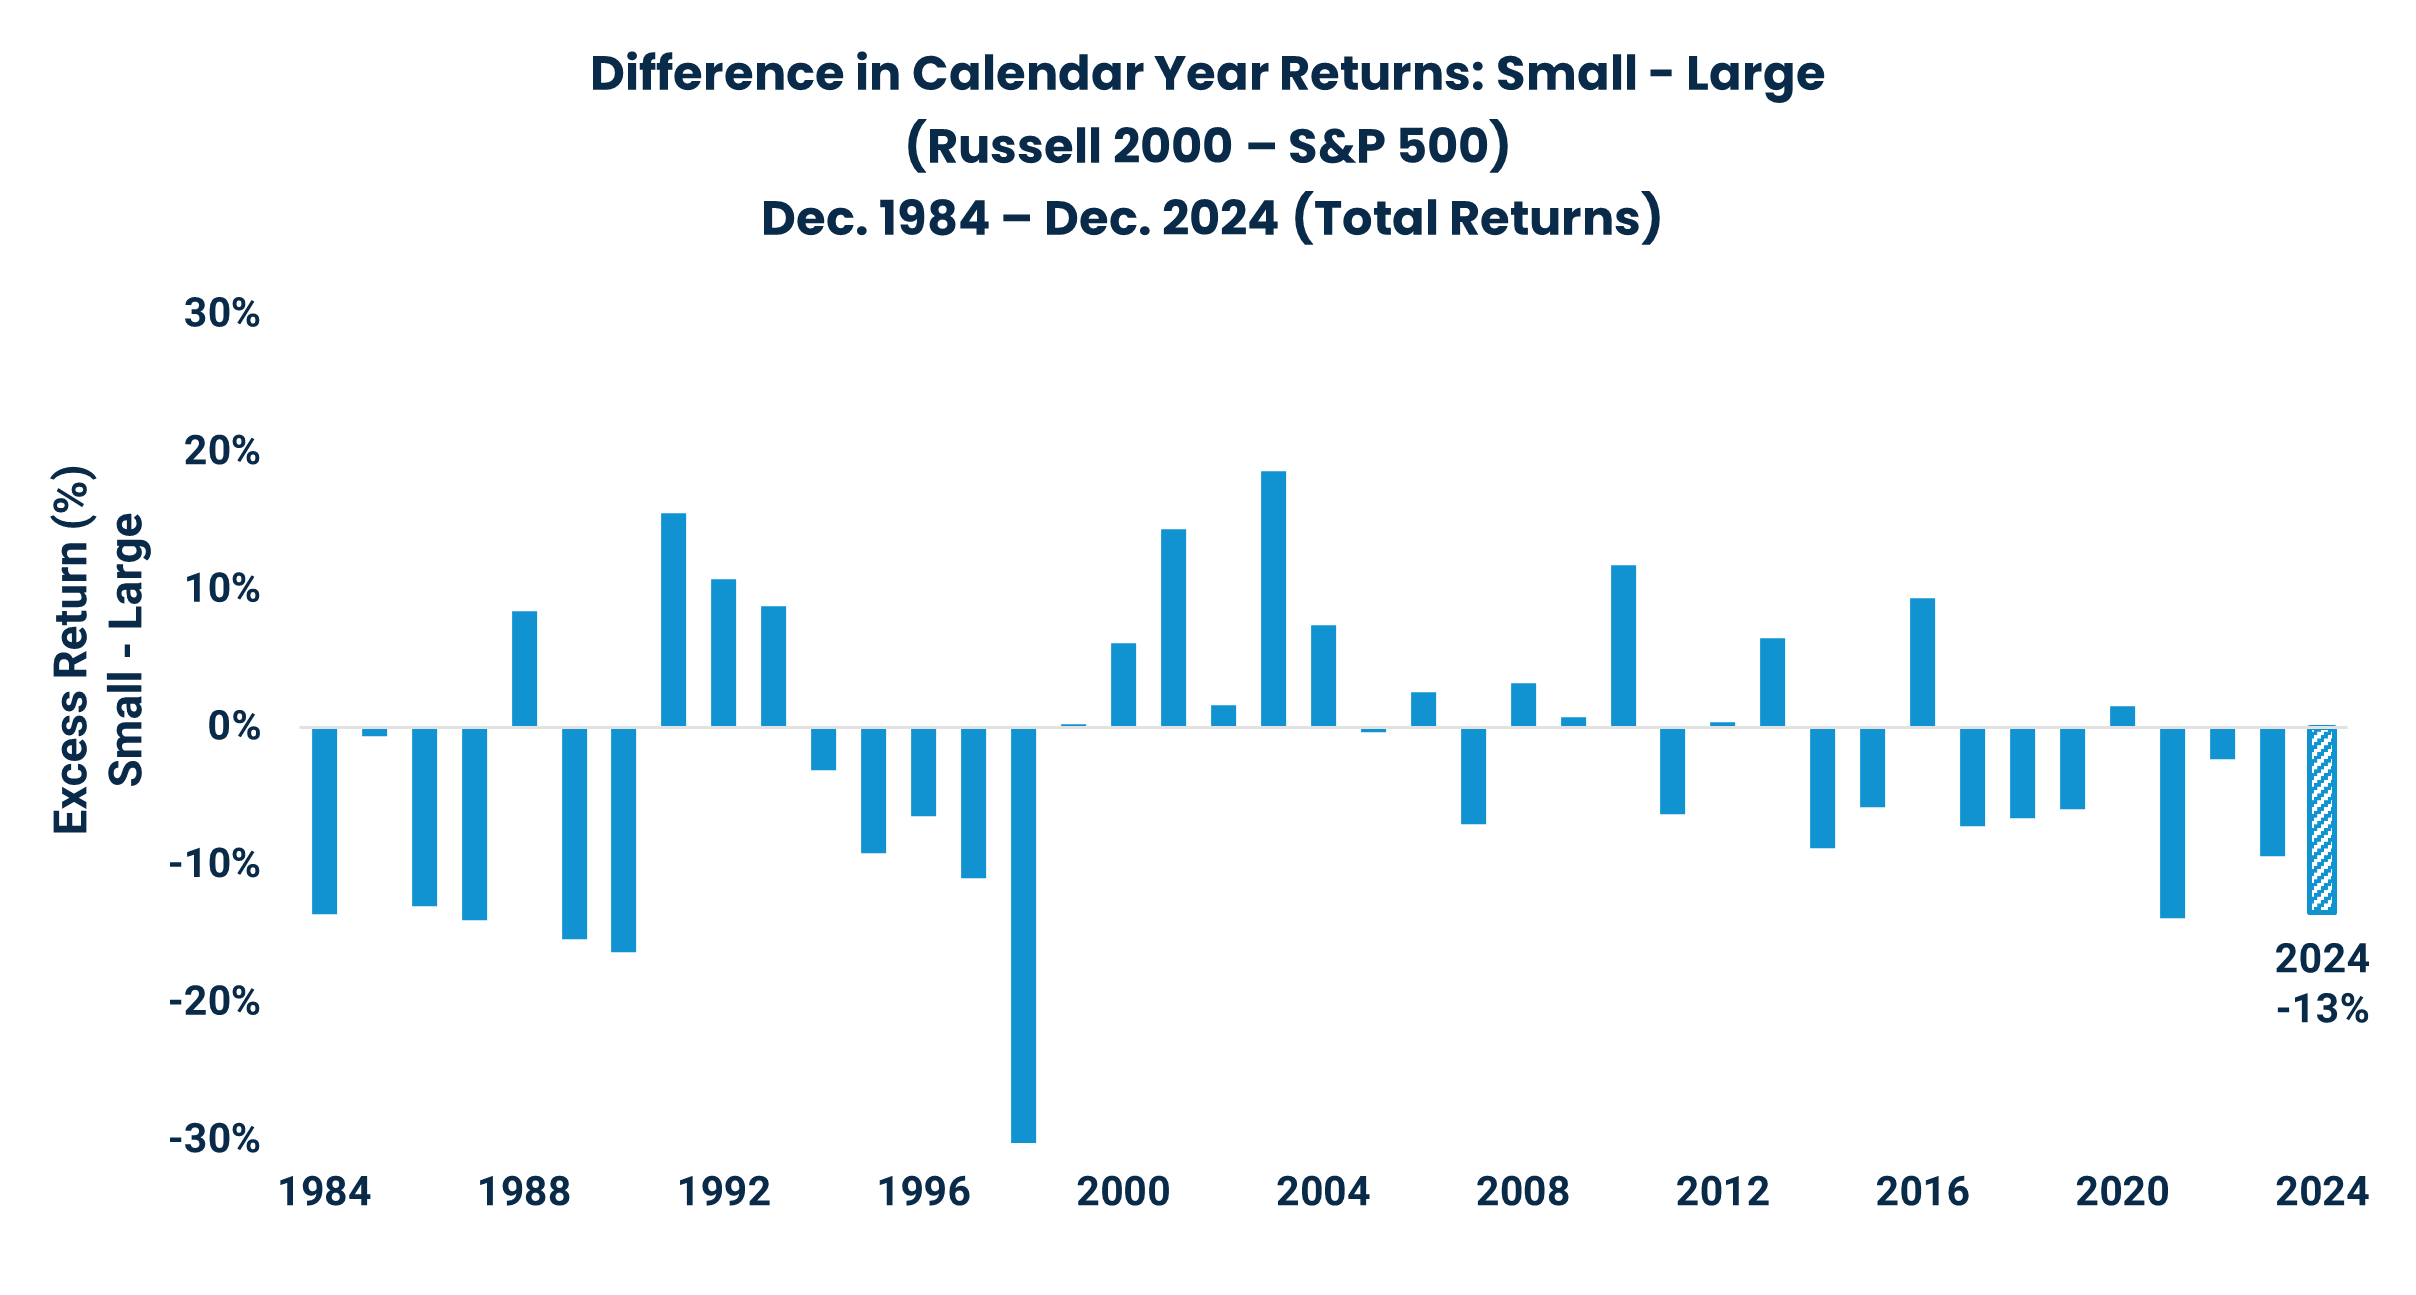
Source: Morningstar Direct; Russell 2000 TR USD & RS&P 500 TR USD monthly, total returns (1/1/1984 – 12/31/2024). Performance data shown represents past performance and is no guarantee of future results.
Q: Looking forward, what do fundamentals suggest about the opportunity set for small cap stocks?
A: As of December 2024, the future earnings of small cap stocks are expected to grow faster than those of large caps. The chart below demonstrates that if fundamentals follow sell-side analyst estimates, then the Earnings-Per-Share (EPS) gap between the S&P 500 and Russell 2000 is expected to narrow over the next two years until it reaches about even by December 2026. Generally, the stock market is driven by earnings growth, so this is an optimistic sign!
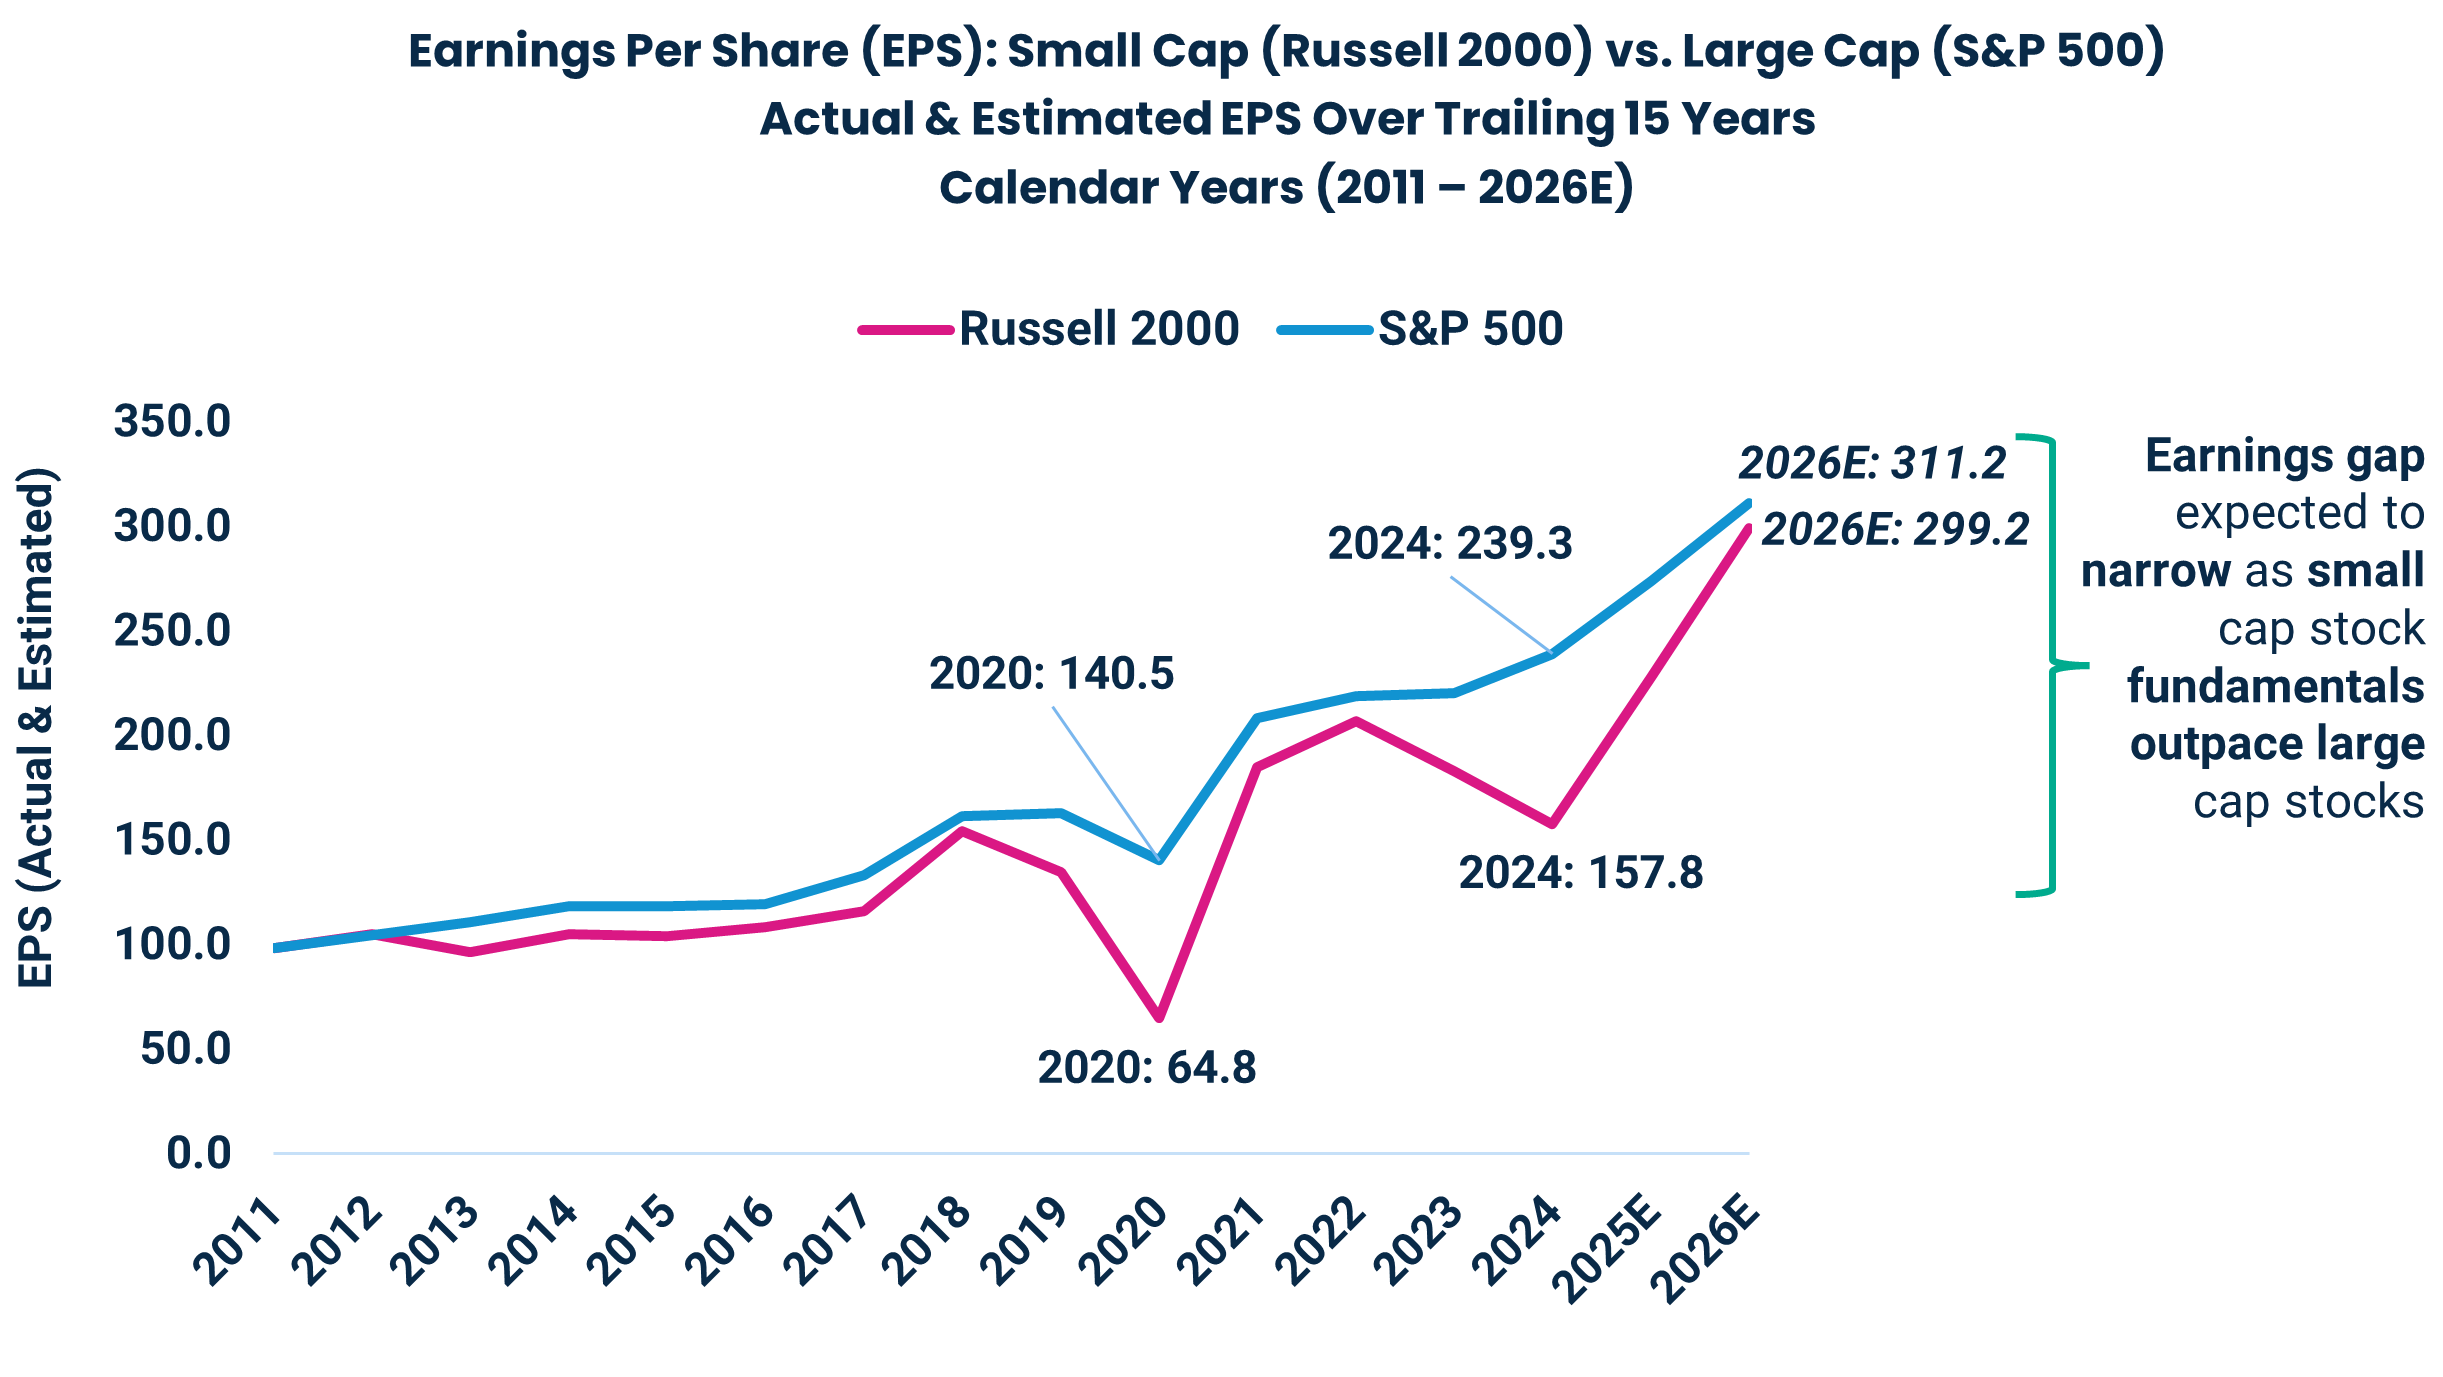
Source: FactSet Research Systems; Russell 2000 & S&P 500. Calendar Year Earnings Per Share actual (2011 – 2024) and estimated (E) (2026). EPS calculated as Aggregate Price / Aggregate Mean Estimated/Actual Price to Earnings Ratio. Mean Estimated Price to Earnings Ratio is calculated as the sum of constituent Market Capitalization divided by the sum of constituent Recurrent Earnings. Recurrent Earnings for each constituent are the calendarized median of per-share broker estimates submitted over a 100-day window, multiplied by the number of shares. Performance data shown represents past performance and is no guarantee of future results.
Q: How could small cap fundamentals actually influence future returns?
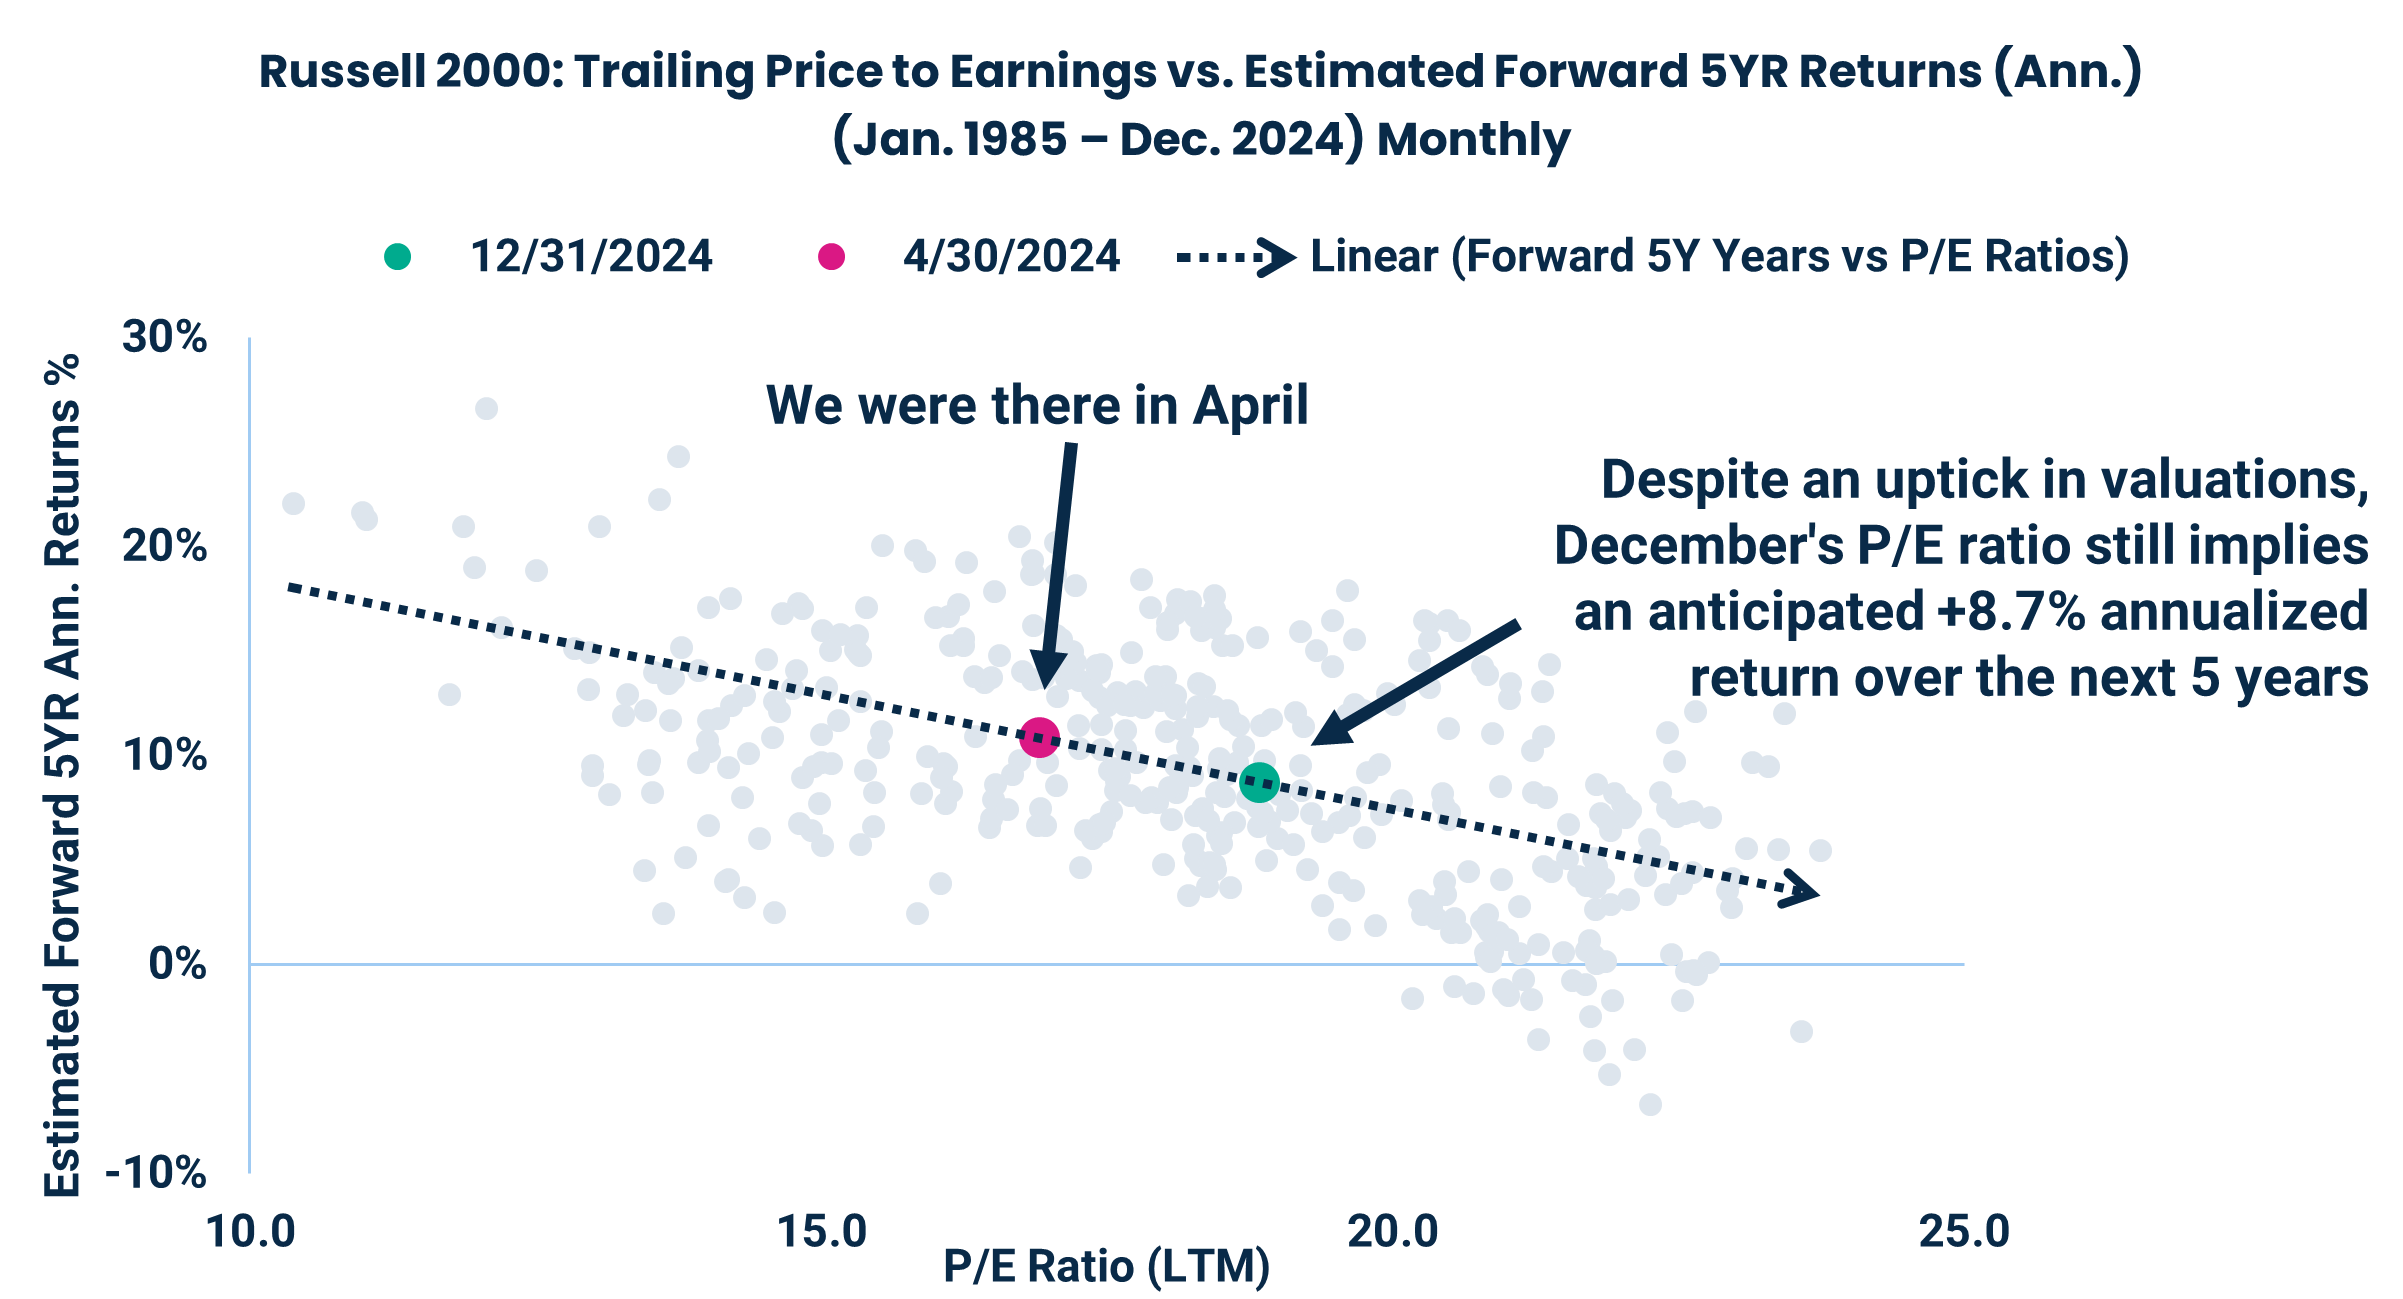
A: Despite a disappointing 2024, based on our trend analysis that plots the Russell 2000’s historical price-to-earnings (P/E) ratio against forward five-year returns, the current ratio estimates an +8.7% per-year return over the next five years.
We updated our last report’s valuation analysis with returns from May 2024 to December 2024. Those returns aligned closely with what the historical trend would have predicted given respective P/E ratios. Jumping to current valuations, the Russell 2000’s median P/E ratio was 18.8 on December 31, 2024, so if history is any indication, this could mean an anticipated forecast return of around +8.7% over each of the next five years. I’d say despite valuations normalizing that’s still pretty attractive!
Source: P/E – FactSet Research Systems; Median Monthly Price to Earnings Ratio over Trailing 12 Months (1/31/1985 – 12/31/2024).
Source: Returns – Morningstar Direct; Russell 2000 TR USD monthly, total returns (1/31/1985 – 12/31/2024). LTM stands for last 12-months. Forward 5YR stands for the next five-year period from the date measured. Performance data shown represents past performance and is no guarantee of future results. There is no guarantee that any of these estimates will come to pass.
Q: The GOP is now in control of the White House and both branches of Congress. How have markets historically performed in similar regimes, and how does that compare to other regime cycles?
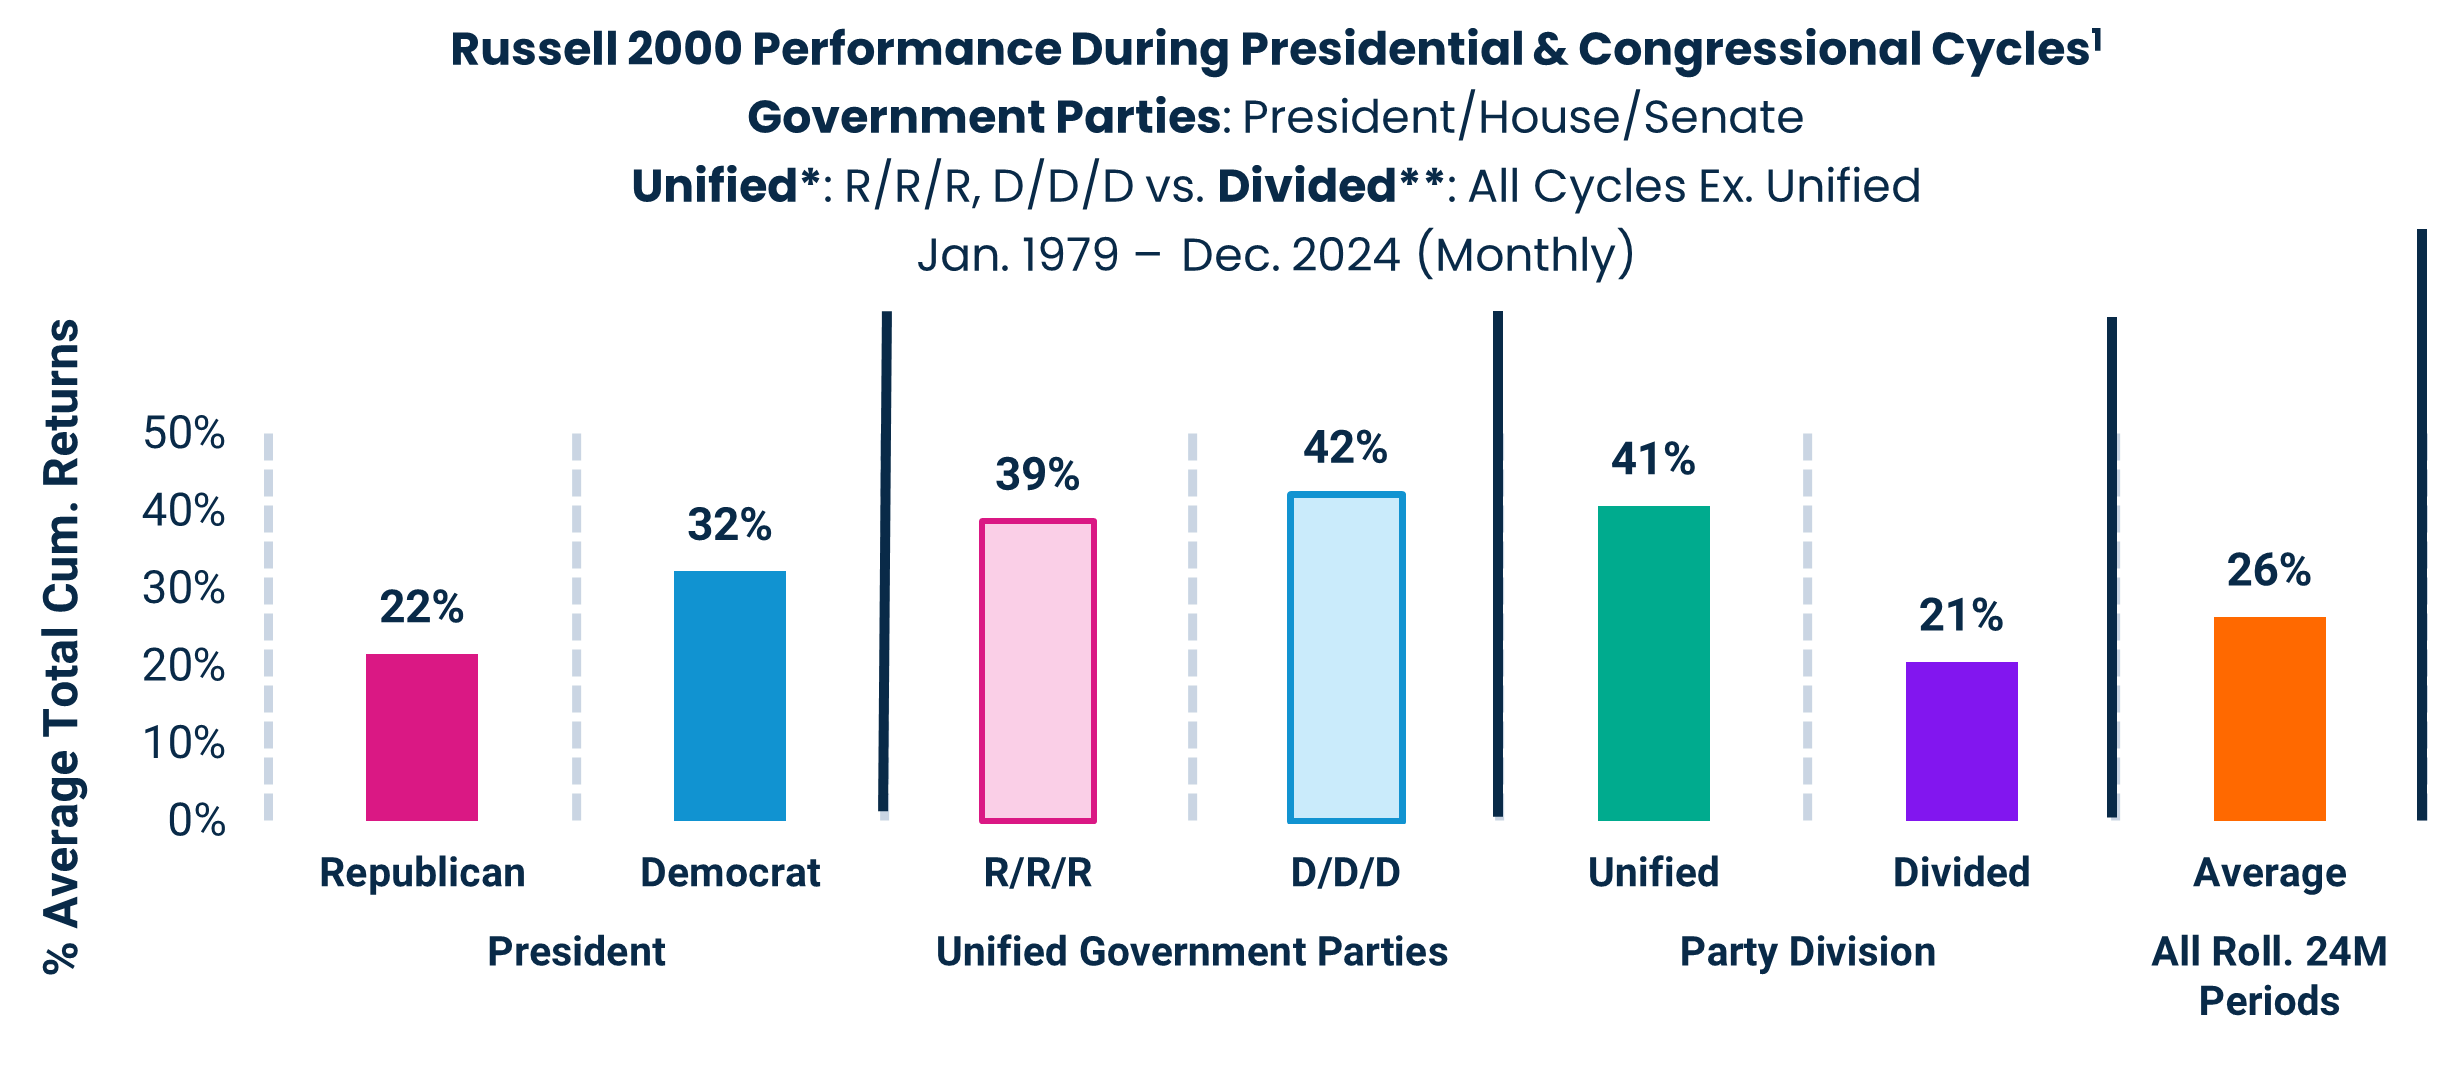
A: The Russell 2000 benefited during past Republican presidential regimes that also featured GOP Congressional majorities, averaging a +39% total return, +8% more than the S&P 500. Heading into a new political era naturally can create investor uncertainty, so we decided to look at historical government administrations in an effort to gauge potential market behaviors under Trump’s next presidential cycle.
Let’s start by examining past cycles with identical government regimes, where Presidential and Congressional majorities were also all Republican (i.e., unified “R/R/R”). Notably, Russell 2000 returns under those past regimes averaged a whopping +39% per cycle, which only lagged a unified Democratic regime (“D/D/D”) by -3%!
We discovered, however, that it doesn’t really matter which party is shared across each branch; it’s simply whether they are unified or not, regardless of Red or Blue. You’ll see in the chart below that the Russell 2000, under a unified regime, averaged a +41% cumulative return — that’s almost double the +21% return under divided regimes!
Source: Morningstar Direct; Russell 2000 TR USD & S&P 500 TR USD monthly, total returns (1/1/1979 – 12/31/2024).
*Unified: When each branch of the Government (President, House, Senate) are of the same majority political party (i.e., all Republican (R/R/R) or all Democrat (D/D/D).
**Divided: When at least one branch of the Government, (President, House, Senate) is not of the same majority political party as the others (i.e., a Government where the President is Republican, House Majority is Republican, but Senate is Democrat R/R/D & all other combinations outside R/R/R and D/D/D). Average All Roll. 24M Periods is the average of all 24 -month periods, rolling monthly, over entire time period measured, meaning all cycle periods and non-cycle periods. Please see “Additional Source Information” on p. 12 for more details on the methodology employed. Performance data shown represents past performance and is no guarantee of future results.
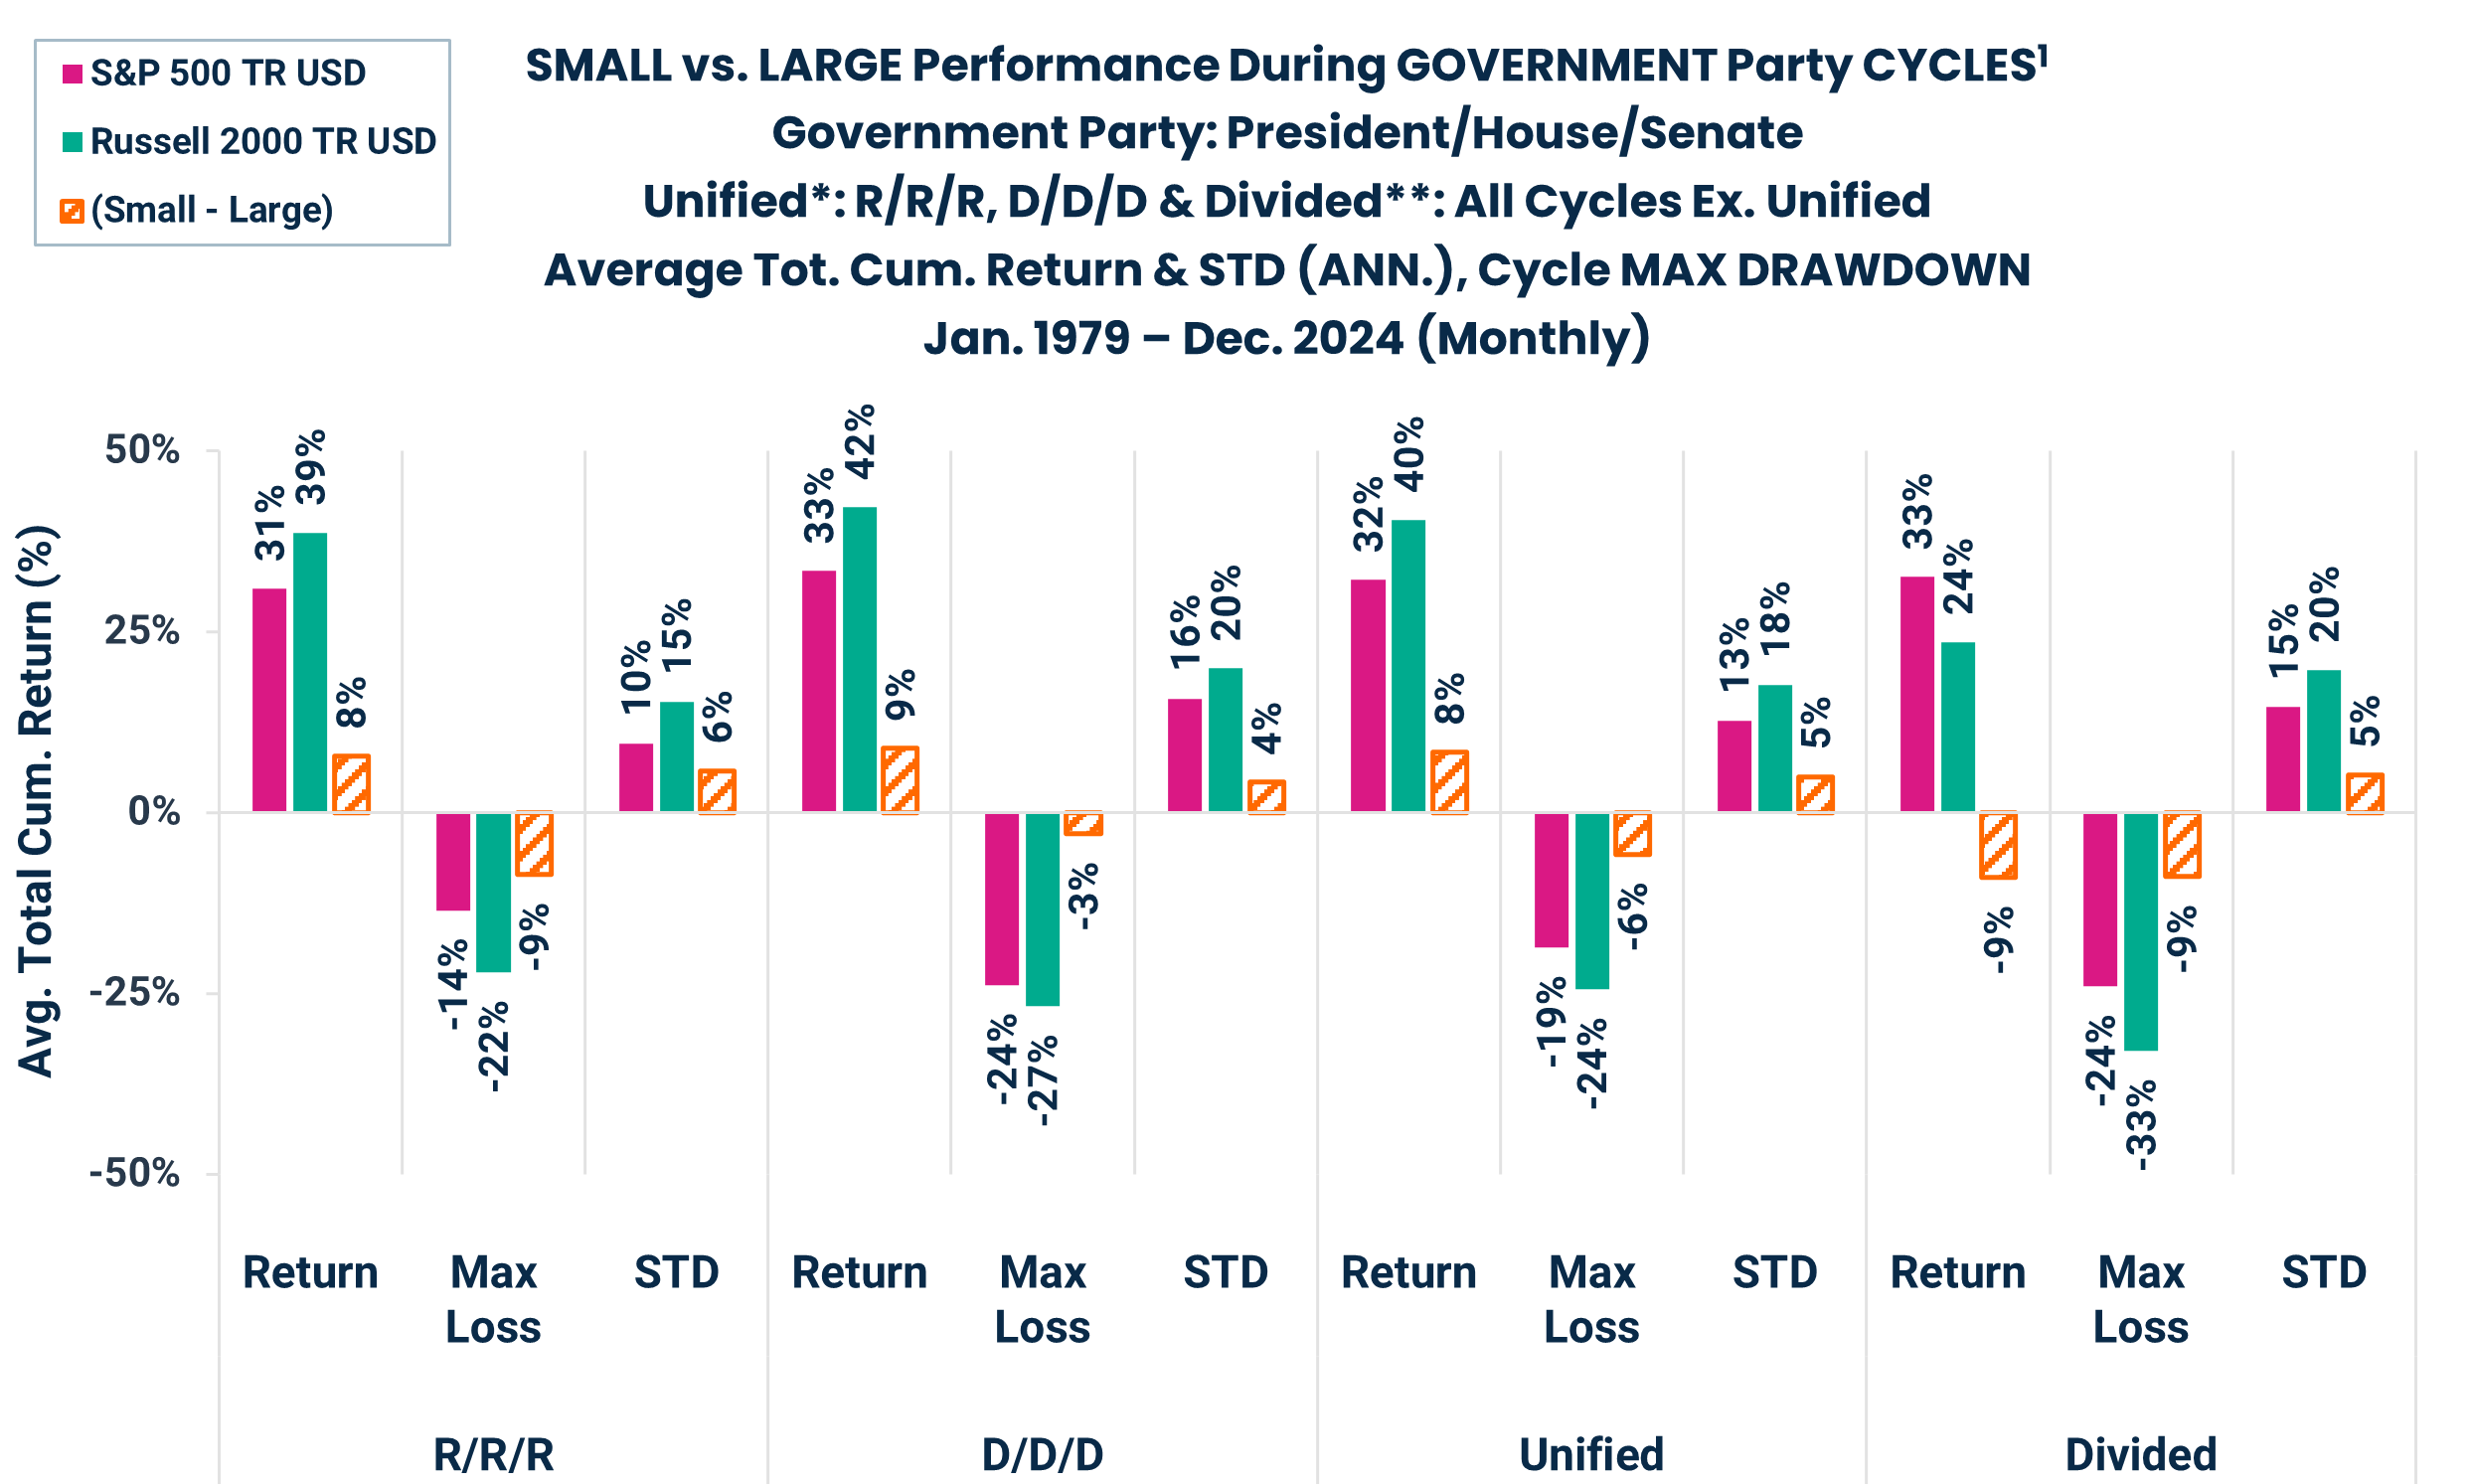
Extending the same analysis through a market-cap lens, small caps historically outperformed large caps (+8%) under a unified government while, conversely, they lagged during divided regimes (-9%).
In summary, historical analysis of various government cycles revealed that small caps produced both strong absolute and relative returns in past unified Republican administrations. However, the key driver of strong performance is a unified regime, irrespective of whether it’s Republican or Democrat. Of course, each cycle has its own unique political, economic, and global dynamics, but if history is any indication, the new administration could be a tailwind for small caps.
Source: Morningstar Direct; Russell 2000 TR USD & S&P 500 TR USD monthly, total returns (1/1/1979 – 12/31/2024).
*Unified: When each branch of the Government (President, House, Senate) are of the same majority political party (i.e., all Republican (R/R/R) or all Democrat (D/D/D).
**Divided: When at least one branch of the Government, (President, House, Senate) is not of the same majority political party as the others (i.e., a Government where the President is Republican, House Majority is Republican, but Senate is Democrat R/R/D & all other combinations outside R/R/R and D/D/D). Please see “Additional Source Information” on p. 12 for more details on the methodology employed. Performance data shown represents past performance and is no guarantee of future results.
Q: How should you think about investing during periods of rising and falling S&P 500 Index concentration?
A: In past periods of rising S&P 500 concentration, the index intuitively typically outperformed the Russell 2000, while the inverse is true in periods of falling concentration.
Large cap index concentration has been rapidly rising over the last five years as the cumulative weight of only a small number of stocks began notably growing and driving the majority of index returns. From “FAANG” to today’s “Magnificent 7,” investors started really pouring dollars into growth stocks in 2020 as the pandemic forced the world to rely entirely on remote technology and online services. While some of the smaller growth stocks couldn’t hold onto that momentum, the innovation theme largely stuck for those bigger, more stable companies (Apple, Microsoft, Amazon, NVIDIA, Tesla, Meta and Alphabet) that have generally benefited from advances in artificial intelligence. In 2024, the top 10 stocks comprised 59% of the S&P 500’s total return!
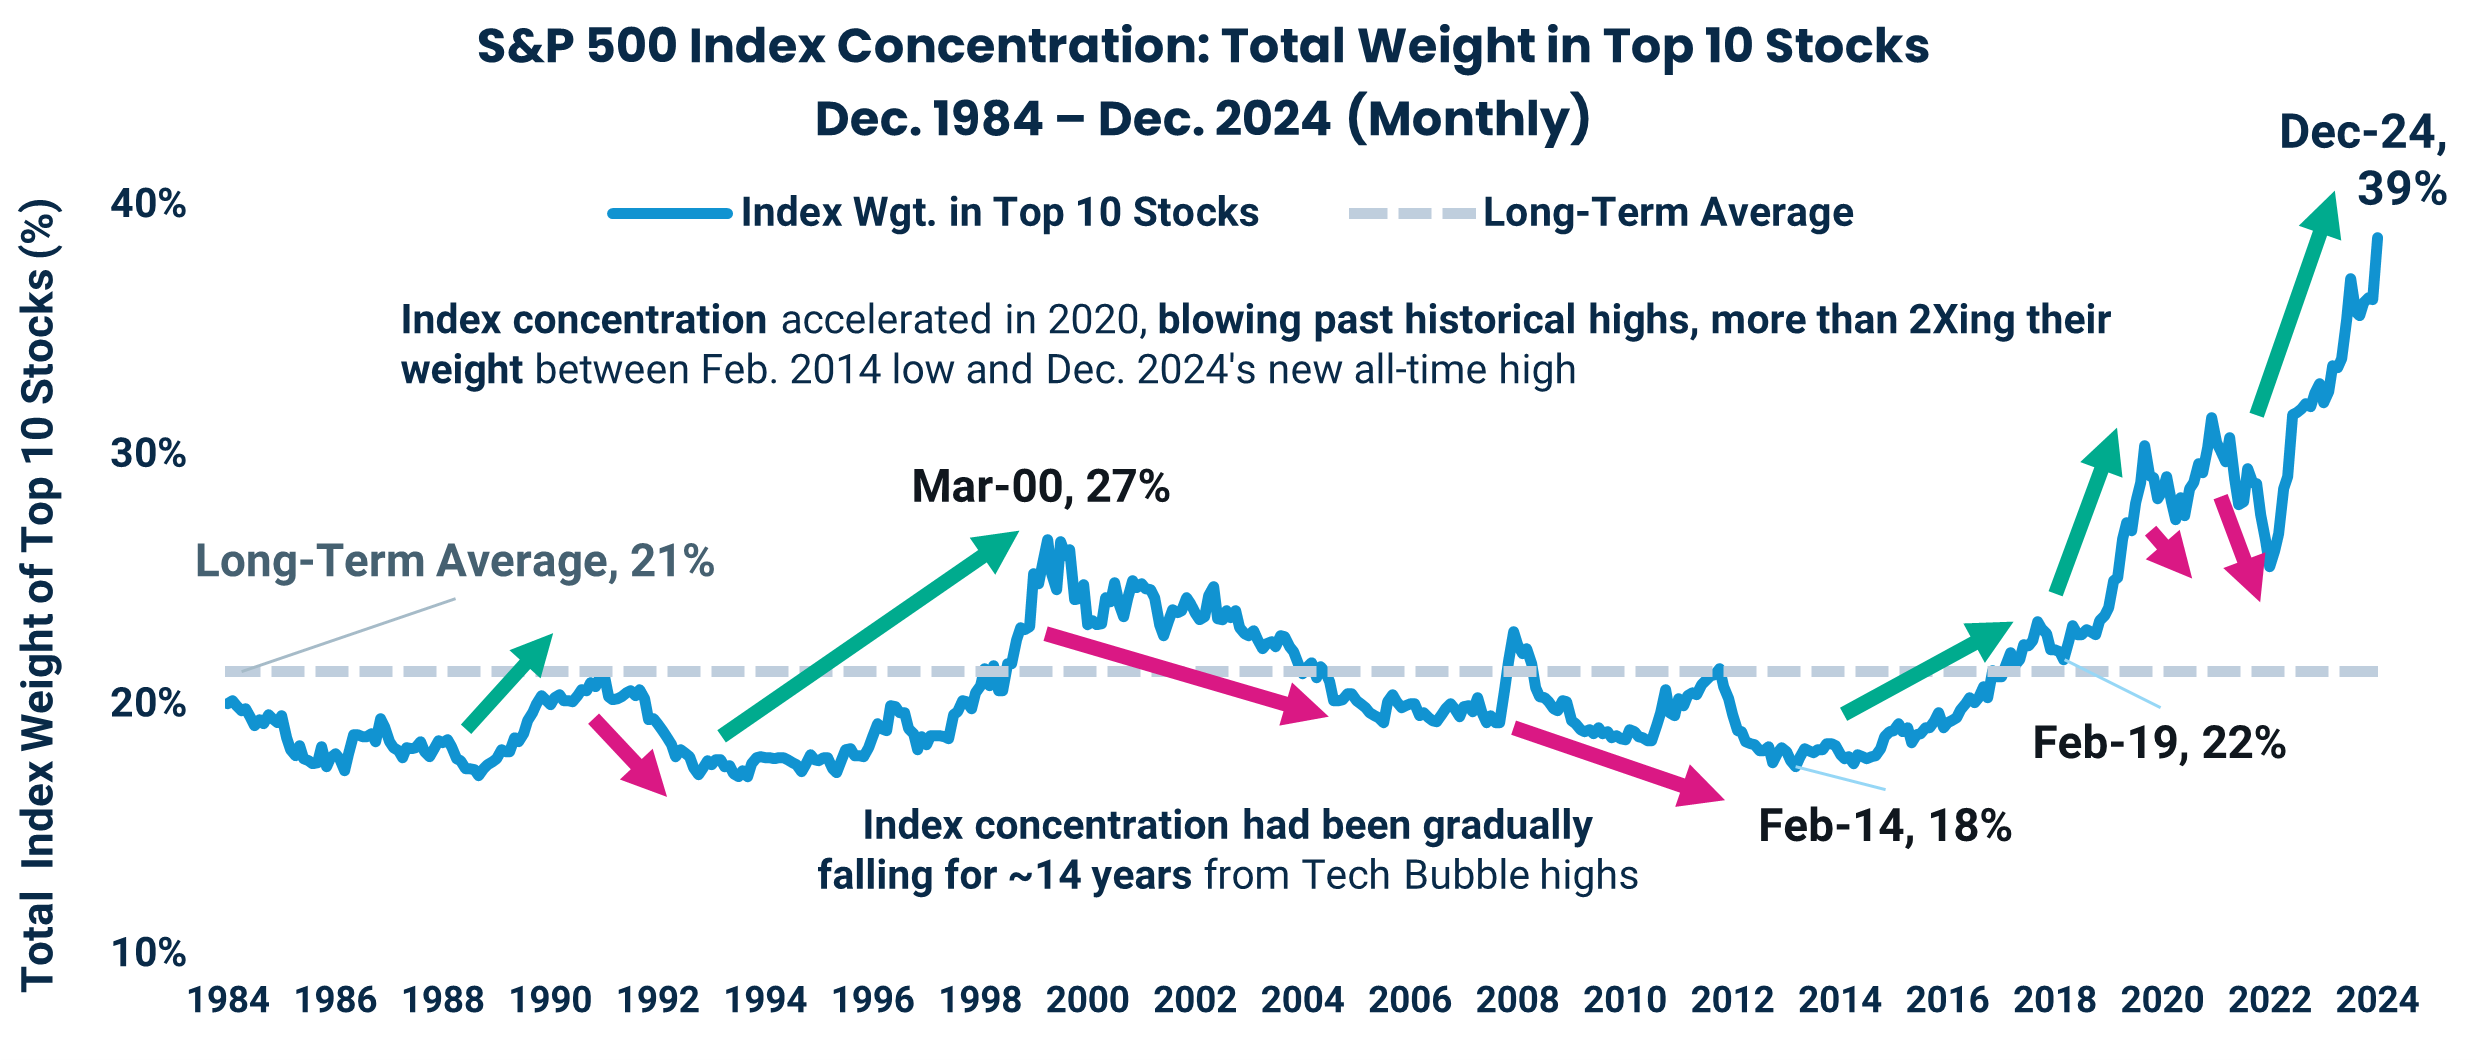
Source: FactSet Research System. S&P 500 Index aggregate weight of top 10 constituents (12/31/1984 – 12/31/2024). Performance data shown represents past performance and is no guarantee of future results.
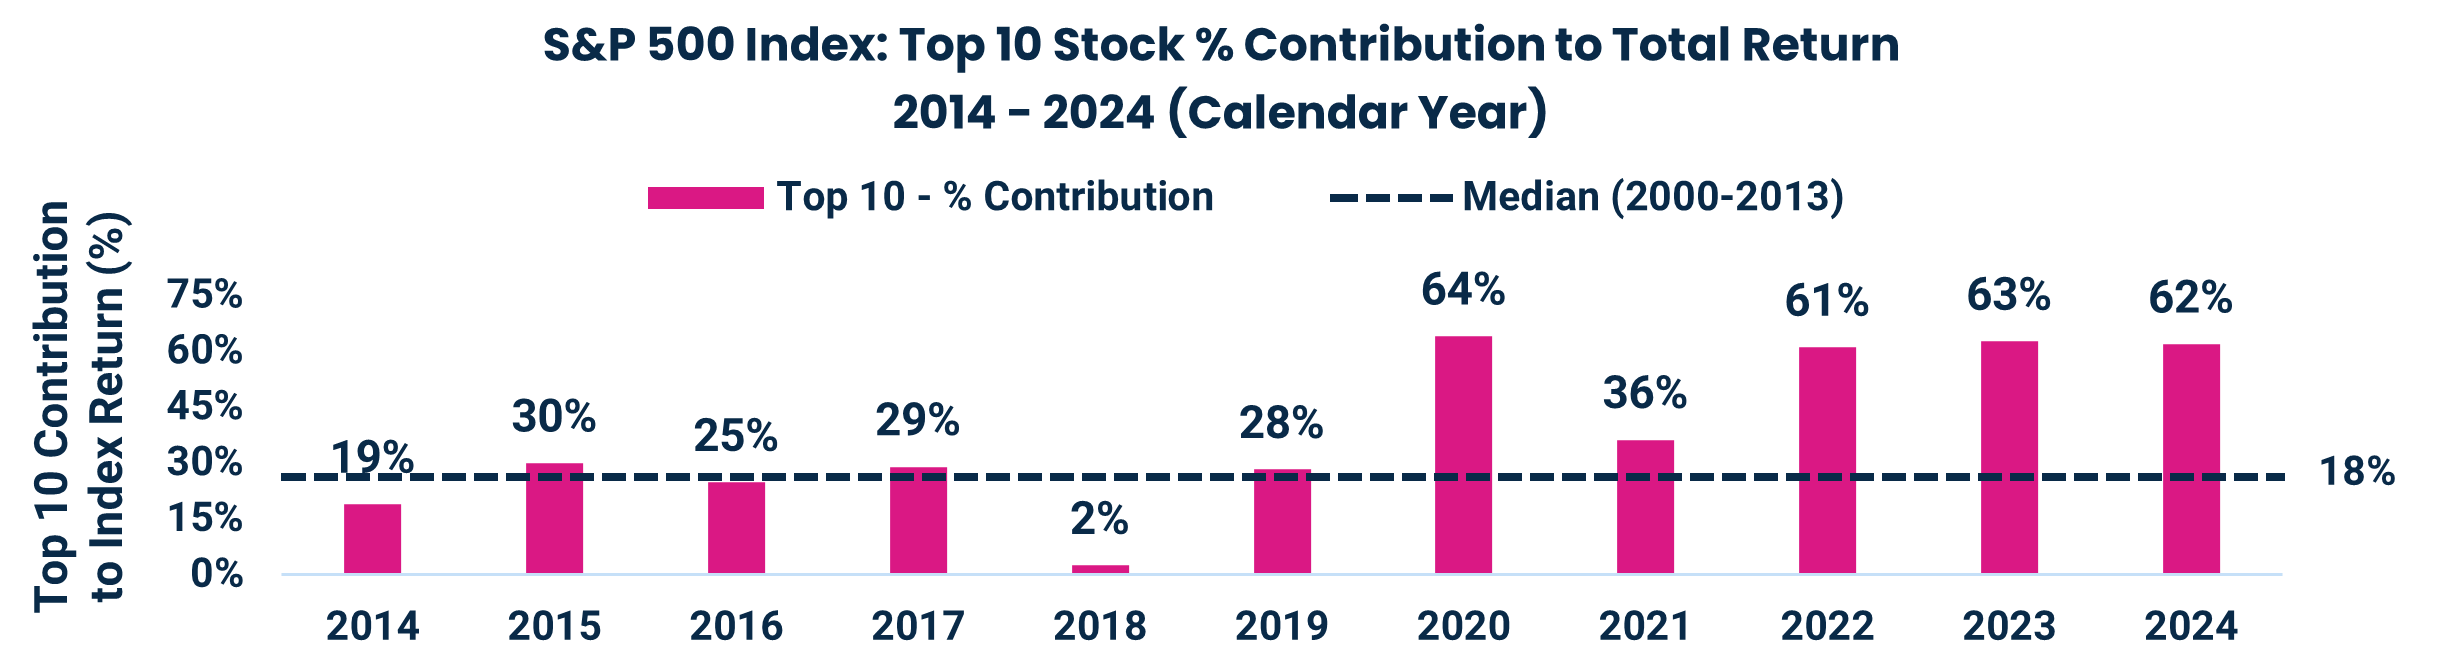
Source: FactSet Research System. The aggregate return contribution of the S&P 500 Index’s top 10 constituents, based on aggregate weight, to the S&P 500 total yearly return at the total index level (Calendar Years: 2014 – 2024). Performance data shown represents past performance and is no guarantee of future results.
Given the Magnificent 7’s price momentum, S&P 500 index investors expecting diversified returns are instead taking a lot of concentration risk — that is, the index performance relies mostly on the top five to 10 stocks. To add to that risk, those stocks are mostly driven by the same macro-factors, meaning they tend to move in tandem when out of favor. That pain may have been felt in recent periods of falling concentration, when most of the Magnificent 7 trailed the S&P 500 at the end of 2020, or when they all tumbled in 2022. In these periods, small caps outperformed large caps, on average, by +9% as the other ~98% of the S&P 500’s holdings couldn’t buffer the losses.
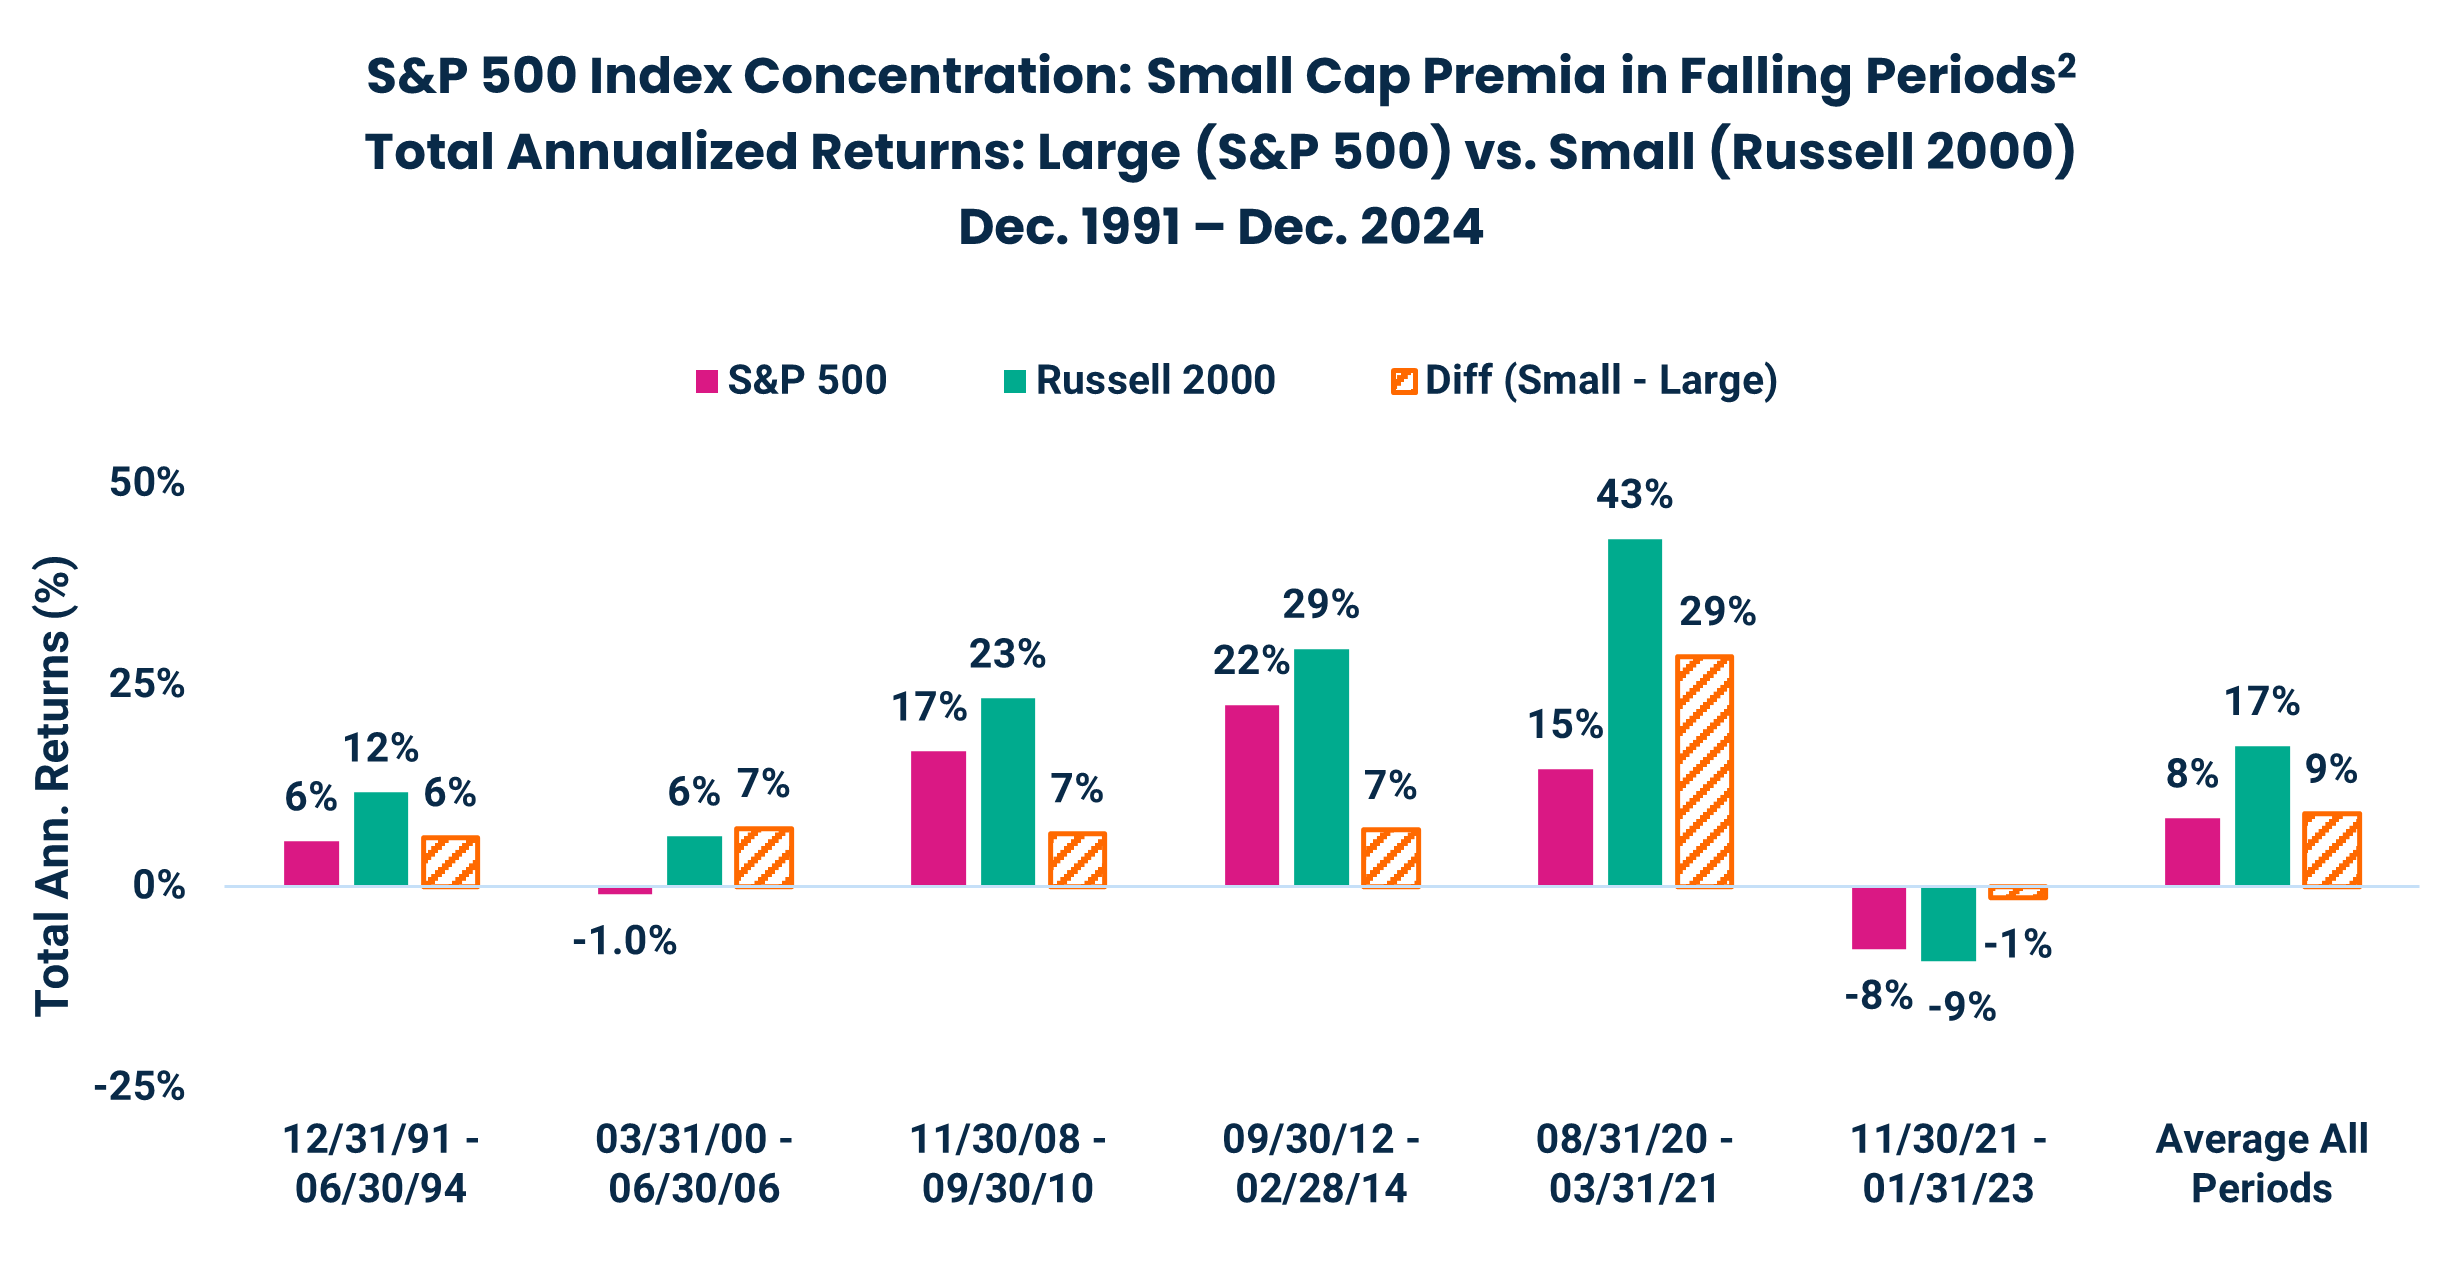
Source: Morningstar Direct; Russell 2000 TR USD & RS&P 500 TR USD monthly, total returns (12/31/1991 – 12/31/2024). Average All Periods is the average of all Falling Periods measured in the chart. The staring date of 1991 represents the first period within the broader time range (Dec. 1984 – Dec. 2024) in which the index concentration fell by more than 3% from its previous high. Performance shown represents past performance and is no guarantee of future results.
To be clear, there’s no doubt that being invested in the S&P 500 has been a good choice over the last decade, but the above analyses highlight that the concentration risk could be (we believe should be) diversified with a small cap allocation that has the potential to buoy returns during periods of falling concentration.
Q: Should you consider an active or passive approach to your small cap portfolio allocation?
A: Interestingly, active small cap managers actually outperformed their benchmarks in both rising AND falling periods of index concentration.
Our research would argue that going active for your small cap allocation is the best decision regardless of large cap index concentration levels. Our analysis also highlights that large cap managers have been more successful when market breadth widens, even as concentrated markets have served as a headwind. It’s interesting to note that large cap managers lagged small cap managers in both scenarios.
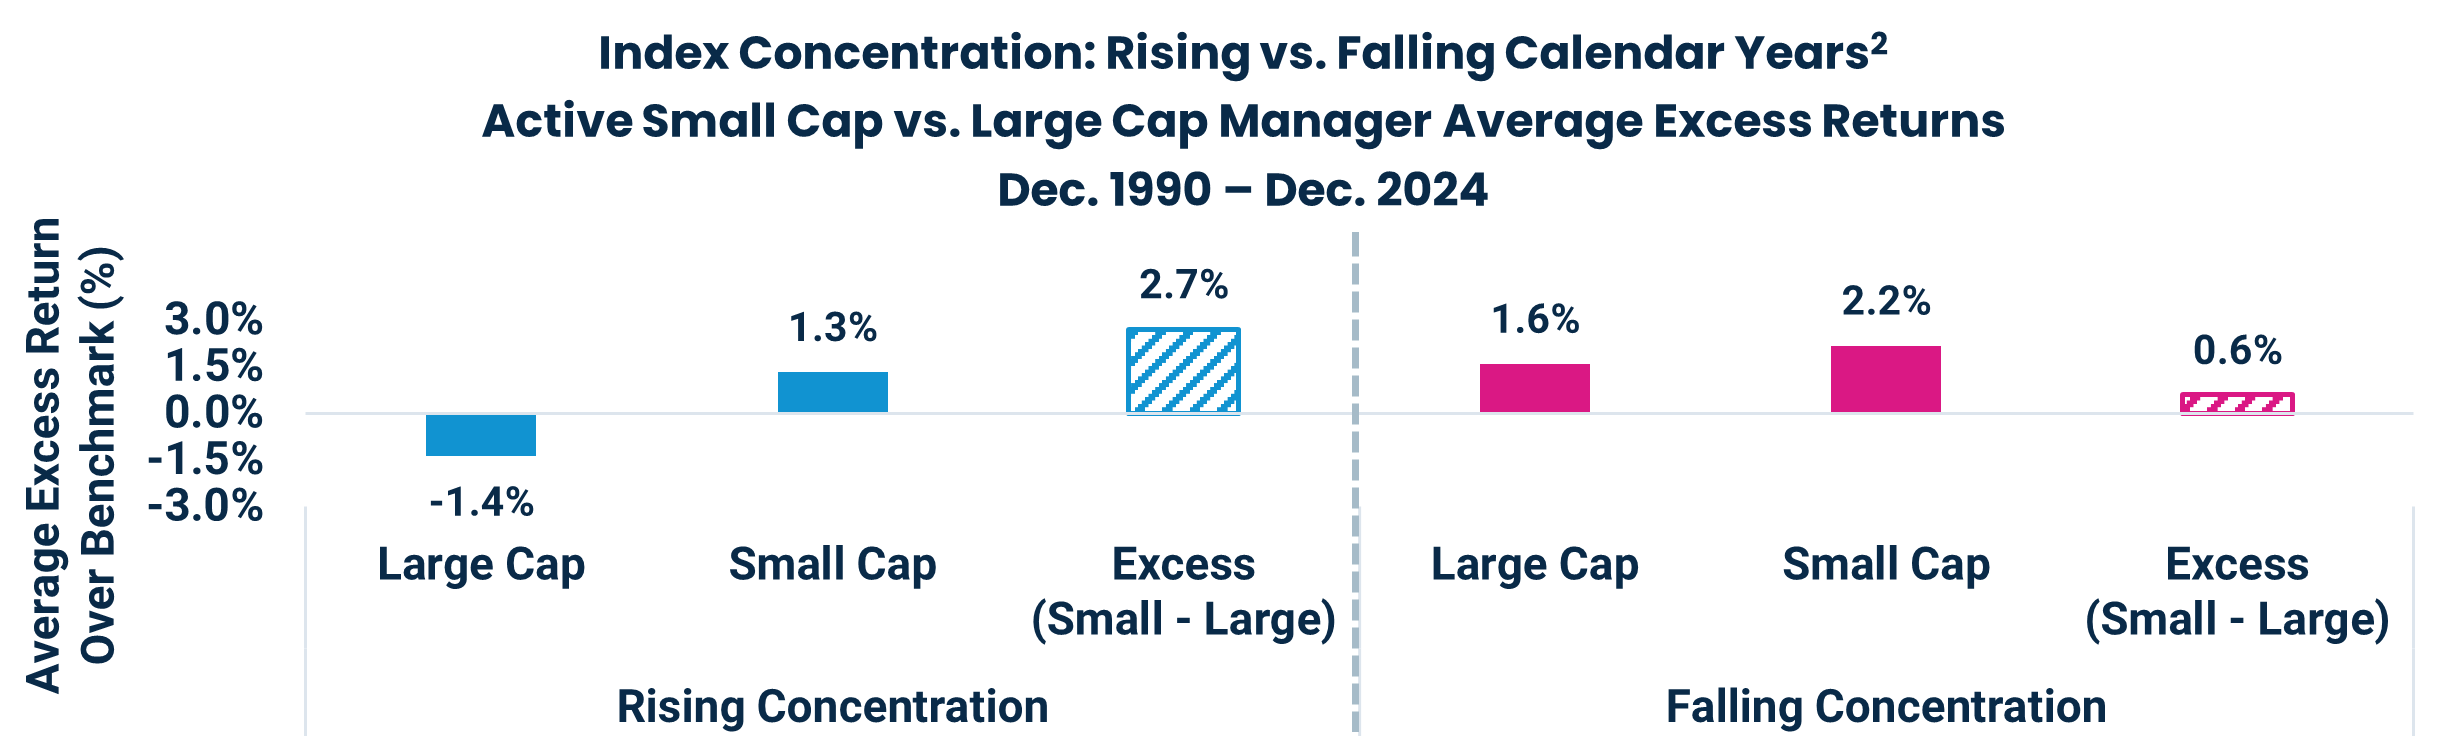
Source: Morningstar; all returns are total and net of fees (12/31/1990 – 12/31/2024). Median Excess Return: Median of excess return calculations of each active fund within Morningstar category versus its primary benchmark. Morningstar categories are assigned by Morningstar using a universe of U.S. Open-End and ETFs, oldest share class, excluding passive index and non-surviving strategies. The starting date of 12/31/1990 represents the first time within the broader time range (Dec. 1984 – Dec. 2024) in which the index concentration increased or decreased by 1.5% or more in a calendar year and in which we had data on active manager category returns from Morningstar (1987). Please see “Additional Source Information” on p. 12 for more details on the methodology employed. Performance shown represents past performance and is no guarantee of future results.
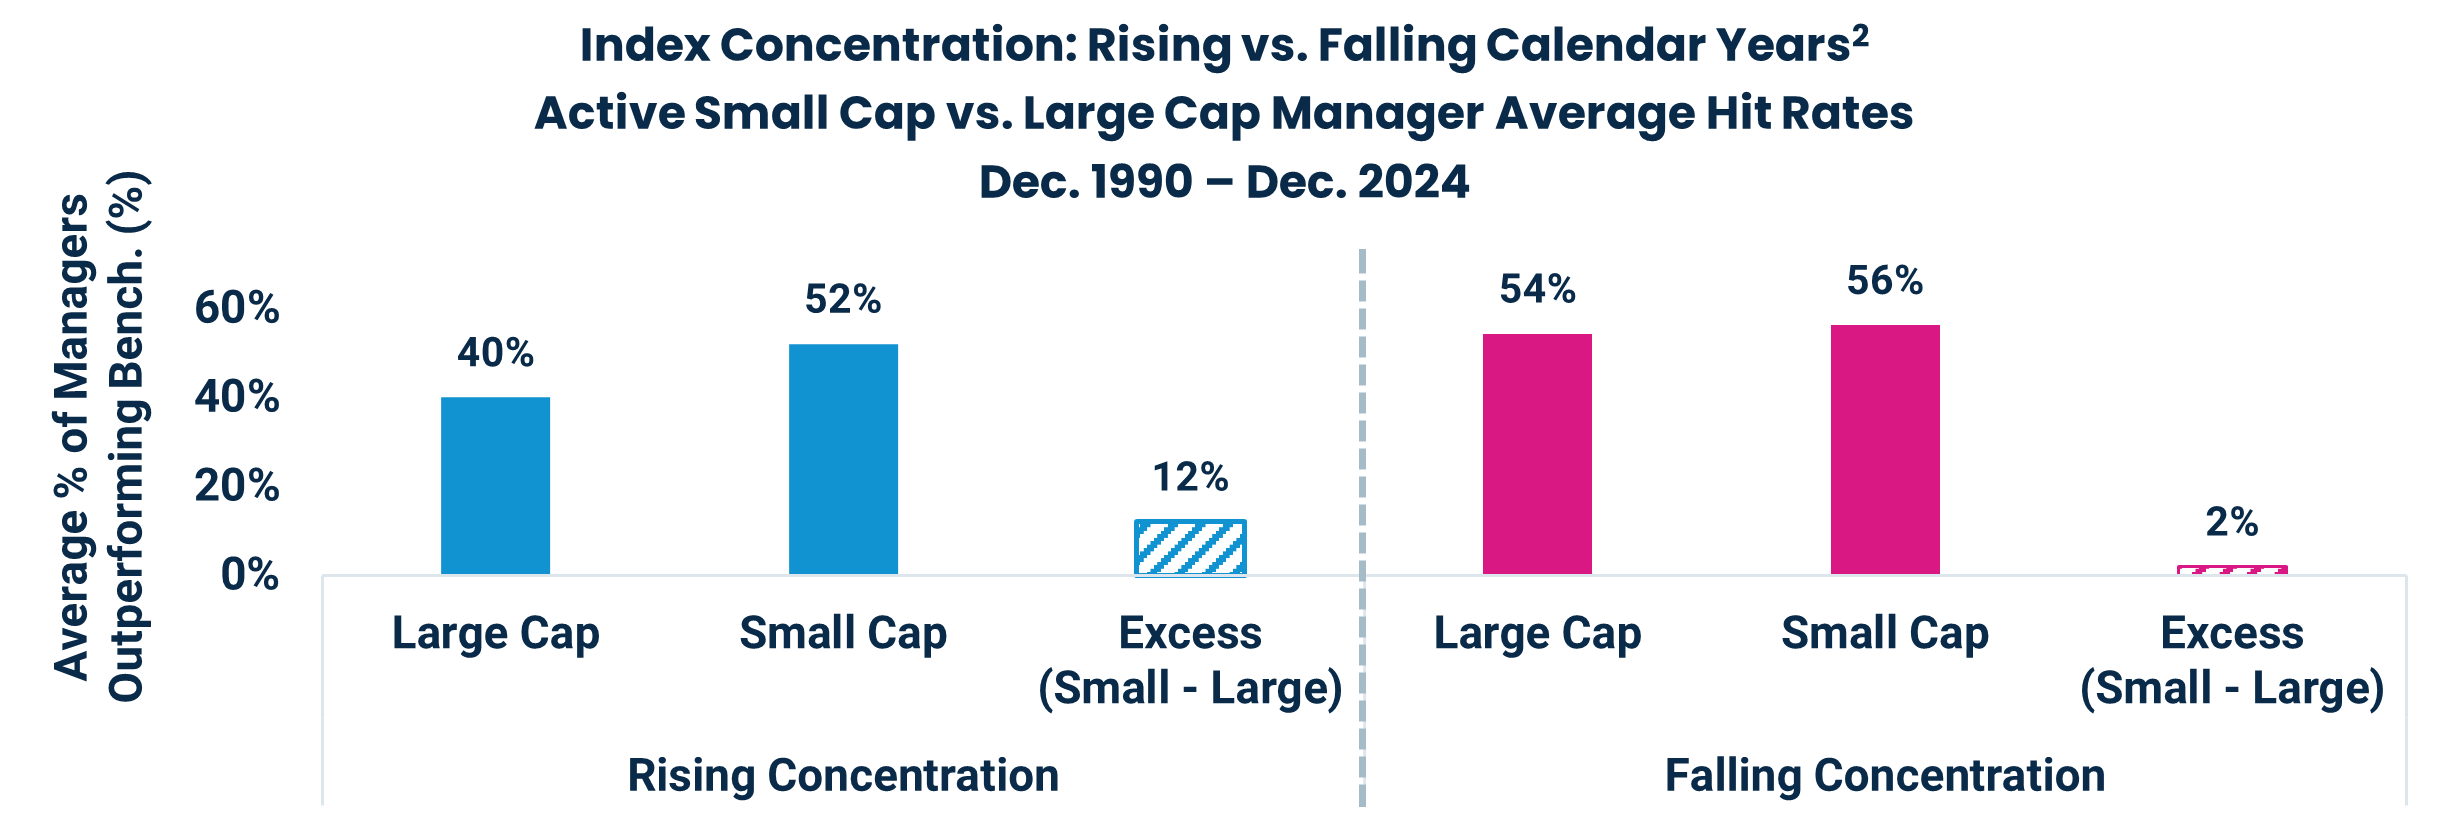
Source: Morningstar; all returns are total and net of fees (12/31/1990 – 12/31/2024). Hit Rate: % of active managers in each respective
Morningstar category outperforming their primary benchmark. Morningstar categories are assigned by Morningstar using a universe of U.S. Open-End and ETFs, oldest share class, excluding passive index and non-surviving strategies. The starting date of 12/31/1990 represents the first time within the broader time range (Dec. 1984 – Dec. 2024) in which the index concentration increased or decreased by 1.5% or more in a calendar year and in which we had data on active manager category returns from Morningstar (1987). Please see “Additional Source Information” on p. 12 for more details on the methodology employed. Performance shown represents past performance and is no guarantee of future results.
As you can see in the charts on the previous page, your large cap manager selection skill has been more important during rising index concentration periods given a majority typically struggle to outperform their benchmarks. This makes sense, as most active managers won’t normally own all the top index holdings at matching weights, if at all. This isn’t to say that you shouldn’t allocate to active large cap managers, but picking the right managers has been crucial over the past five years.
The charts on the previous page also show that small cap managers, on average, were able to outperform both their benchmarks by +130 to +220 basis points (bps) AND large cap managers by +60 to +270 bps in BOTH environments. Their excess return over large cap managers is more pronounced when concentration is rising.
In summary, generally large cap managers have struggled in periods of high index concentration but historically have found success when concentration levels fall. Meanwhile, on average small cap managers have been able to produce alpha in both rising and falling environments. As we’ve called out throughout this piece, it’s important to be aware of inherent concentration risk, which can work against you when breadth widens. To hedge this risk, we think diversifying your portfolio with an active small cap allocation has the potential to address both risks and may help in rising and falling concentrated markets.
Important Information
Additional Source Information
1 Presidential & Congressional Cycles: Cycles are measured starting from January of the first year that either the President, the House of Representatives or Senate go through a re-election period. Since House Representatives have an election cycle every 24 months, and the President doesn’t take office until January 20, the cycle ends on the January two years later when a new cycle begins. The first cycle begins 1/31/1979 (inception of the Russell 2000 Index) and the last cycle ends 12/31/2024 because this is through year end.
2 Index Concentration Rising & Falling Periods: Rising and falling periods using monthly data, are measured as percentage point changes in the aggregate weight of the top 10 holdings of the S&P 500 Index from a peak to a bottom, using only the top to bottom periods that either increased or decreased by at least +/-3% or more. Rising & falling calendar years are measured as years where the aggregate weight of the top 10 holdings of the S&P 500 Index increased or decreased by at least +/-1.5% or more. The threshold is lower for calendar years as they have shorter periods of measurement compared to full period peaks and bottoms.
The views expressed herein may not be reflective of current opinions, are subject to change without prior notice. This material is for informational and illustrative purposes only. This material does not constitute investment advice and should not be viewed as a current or past recommendation or a solicitation of an offer to buy or sell any securities or to adopt any investment strategy.
Investing entails risks and there can be no assurance that any investment will achieve profits or avoid incurring losses.
Investing in stocks of small cap companies involves unique risks, including potential illiquidity and heightened price volatility compared to stocks of larger, more established companies. Small cap stocks may be subject to more abrupt and pronounced fluctuations in market price, and they may be harder to buy and sell without impacting the market price significantly. Investors should consider these factors when assessing the suitability of small cap stocks for their portfolio.
This material may contain forward-looking information that is not purely historical in nature. Such information may include, among other things, projections, estimates and forecasts. There is no guarantee that any of these will come to pass.
The Russell 2000® Index is an unmanaged index generally representative of the smallest 2000 stocks included in the Russell 3000 Index. The Russell 3000® Index is an unmanaged index generally representative of the largest 3000 stocks in the U.S. The Standard & Poor's 500 Index (S&P 500 Index) is an unmanaged index generally representative of the U.S. market for large capitalization equities. These unmanaged indices do not reflect fees and expenses and are not available for direct investment. The Russell Indices listed above and Russell® are trademarks of Frank Russell Company.
Indices listed are unmanaged and do not reflect fees and expenses and are not available for direct investment.
©2024 Morningstar, Inc. All rights reserved. The information contained herein (1) is proprietary to Morningstar and/or its content providers; (2) may not be copied or distributed; and (3) is not warranted to be accurate, complete, or timely. Neither Morningstar nor its content providers are responsible for any damages or losses arising from any use of this information.
Alpha is the risk-adjusted excess return of an investment above its benchmark return.
Price-to-earnings (P/E) ratio is the proportion of a company's share price to its earnings per share.
Earnings per share (EPS) is a company's net income subtracted by preferred dividends and then divided by the number of common shares it has outstanding.
Hit rate is the percentage of time when excess return is positive.
A basis point is one one-hundredth of a percentage point.
4256564


