 Contact
In Pursuit of Manager Skills
August 22, 2023Executive Summary
Excess return and alpha are two common metrics to evaluate a strategy’s performance. Numerous studies have pointed to the negative excess returns of active managers in recent decades as evidence that, as a group, they do not have skills. In this research, we examined the relationship between idiosyncratic alpha1, which we consider to be a measure of an active manager’s skill, and excess return.
We looked at historical active equity strategy returns2 for U.S. Large Cap, U.S. Small Cap, and Emerging Markets categories, as defined by Morningstar3. Namely, our research showed that:
-
Strategies with higher idiosyncratic alpha tended to have higher excess returns and hit rate4 during the same return window. However, a closer look at the average idiosyncratic alpha across strategies over time revealed a different trend from that of the average excess returns.
-
Idiosyncratic alpha has done a better job of forecasting strategies’ future performance than excess return. We observed that strategies that have generated higher idiosyncratic alpha historically and had greater potential to outperform their peers5, while the same forecasting power cannot be found using trailing excess returns.
-
Strategies with low idiosyncratic alpha more frequently underperform their peers5. However, we found limited evidence that strategies with high idiosyncratic alpha were able to outperform persistently.
We start our analysis with U.S. Large Cap active strategies. We observed similar results for U.S. Small Cap and Emerging Markets funds, which we summarize in the second section.
Performance data shown represents past performance and is no guarantee of future results. Returns from Morningstar are all net of fees.
1Idiosyncratic alpha is the portion of a strategy’s return not explained by the market and risk factors. See Important Information for detailed methodology.
2We consider active strategies to include Morningstar U.S. Large Cap category Funds (between the years 1985 and 2022, a total of 2820 funds were included), U.S Small Cap Category Funds (between the years 1985 and 2022, a total of 1076 funds were included), and Emerging Market Category Funds (Between the years 1986 and 2022, a total of 415 funds were included). Open-ended Mutual Funds which are not index Funds and enhanced index Funds, as defined by Morningstar. Only oldest share class for each fund is included.
3Historical performance data starts from 12/2001 to 12/2022 for Large Cap and Small Cap Active Strategies, and it starts from 12/2005 to 12/2022 for Active Emerging Markets Strategies.
4Hit rate is the percentage of time when excess return is positive.
5Our definition of peers includes active strategies that are in the same category (U.S. Large Cap (including 1912 funds in the category), U.S. Small Cap (including 773 funds in the category), and Emerging Markets (including 255 funds in the category) and have at least a 36-month tracking record. Only the oldest share class is included.
Large Cap Active Strategies6
-
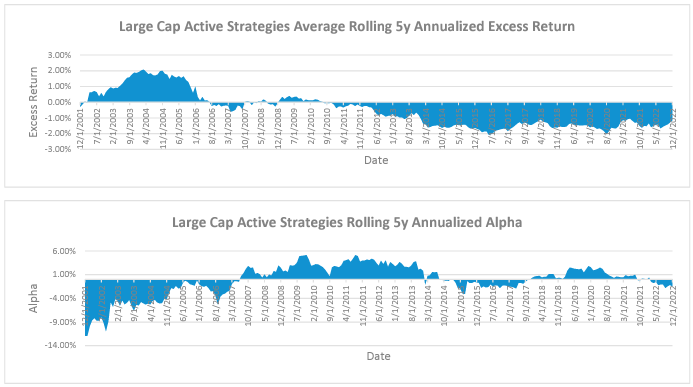
We observed that, on a rolling 5y basis7, Large Cap active strategies on average had a 6.6% annualized total return net of fees8, lagging their respective category benchmarks by roughly 50 basis points (bps). Meanwhile, the average strategy-level idiosyncratic alpha was -19 bps.6
-
The rolling 5y average excess return was positive prior to 2007 and turned negative after 2010. However, our research showed that the trend for idiosyncratic alpha was the opposite – alpha was negative prior to 2007 and turned positive most of the time afterwards. This suggested to us that despite factor headwinds, on average active large cap managers were able to produce positive alpha during the last decade.
Performance data shown represents past performance and is no guarantee of future results. Returns from Morningstar are all net of fees.
6We include all active strategies in Large Cap Blend, Large Cap Growth and Large Cap Value Morningstar categories for this analysis.
7The rolling 5-year performance is a monthly time series from 12/31/2001 to 12/31/2022.
8Returns from Morningstar are all net of fees. We included the oldest share class as part of our calculation.
-
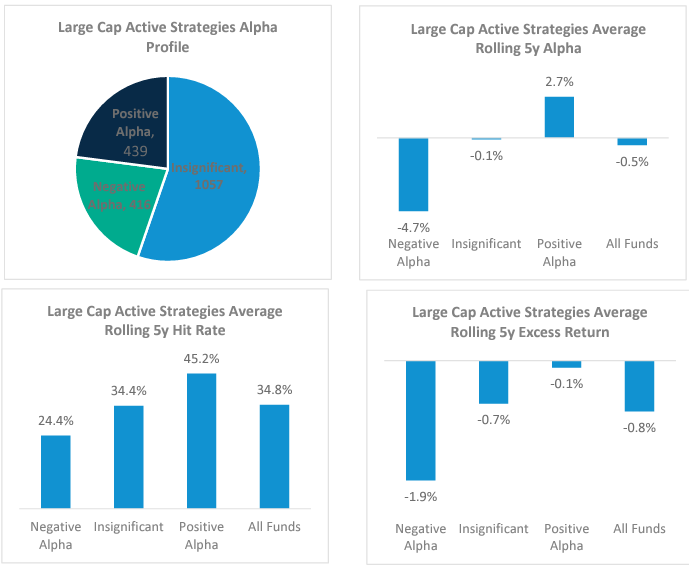
We grouped strategies by their ability to consistently generate idiosyncratic alpha9 and looked at the average excess returns during the same return window by alpha group. We observed that strategies with consistently positive idiosyncratic alpha had the highest excess return and hit rate, while strategies with consistently negative idiosyncratic alpha had the lowest excess return and hit rate.
-
There were 1,912 Large Cap active strategies in total with long enough track record10 between 12/2001 and 12/2022 for our analysis, out of which 439 strategies have consistently generated positive alpha, 416 have consistently generated negative alpha, and the remaining 1057 strategies’ alpha was not statistically significant.
-
The average annualized alpha for the positive alpha group was 2.7% and -4.7% for the negative alpha group. There is a meaningful gap (~7%) of alpha generation capabilities between these two groups of strategies, in our estimation.
-
We noted that the gap in excess return between the two groups was large. Annualized rolling 5y excess return of the positive alpha group was 1.8% higher than that of the negative alpha group. Meanwhile, hit rate of these excess returns for the former almost doubled that of the latter group.
-
9We measure consistency by the t-statistics of a strategy’s monthly rolling 5y idiosyncratic alpha. If the t-stats is greater than 1.69, the strategy has consistently generated positive alpha; if the t-stats is lower than -1.69, the strategy has consistently generated negative alpha; if the t-stats is between -1.69 and 1.69, the alpha the strategy has generated is insignificant.
10We require at least 36 months of return data for a strategy to calculate idiosyncratic alpha, and we require at least 36 alpha data points to calculate t-statistics.
Source: Harbor Capital and FactSet, May 2023
Performance data shown represents past performance and is no guarantee of future results. Returns from Morningstar are all net of fees.
-
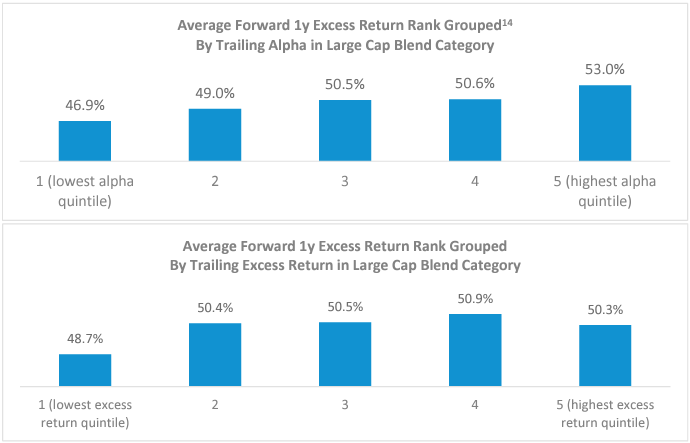
To assess the relationship between idiosyncratic alpha and potential future performance, we ran a yearly back test, where we divided strategies11 into quintiles based on their trailing 5y idiosyncratic alpha12 and examined the average forward 1y excess return rank13 for each quintile. In our assessment of the data, strategies with the highest idiosyncratic alpha performed the best in the subsequent 12 months, while strategies with the lowest idiosyncratic alpha performed the worst. However, if we ranked strategies by their trailing excess return instead, there was little differentiation in future performance among quintiles.
11Strategies include all active strategies in Large Cap Blend, Large Cap Growth and Large Cap Value Morningstar categories for this analysis. We require at least 36 months of return data for a strategy to calculate idiosyncratic alpha, and we require at least 36 alpha data points to calculate t-statistics.
12We adjust alpha by its standard error for this exercise. Alpha is the regression intercept, and we adjusted it by dividing the standard error of the regression intercept. The adjusted alpha is the t-stats of the regression intercept.
13We use rank within each strategy’s respective U.S. Morningstar category (Large Cap Growth, Large Cap Value and Large Cap Blend) for this exercise. The performance is ranked within each subcategory – Large Cap Growth, Large Cap Value and Large Cap Blend – not the entire blended large cap category, and only active funds. A high ranking is more attractive.
Source: Harbor Capital and FactSet, May 2023
Performance data shown represents past performance and is no guarantee of future results. Returns from Morningstar are all net of fees.
-
We observed that strategies with high idiosyncratic alpha (highest alpha quintile) are more likely to have the strongest returns and that strategies with low idiosyncratic alpha (lowest alpha quartile) are more likely to have the weakest returns. To assess performance persistence, we tracked funds’15 trailing 5y excess return and the subsequent 12-month excess return. At the end of each month, we divided funds into tertiles16 based on their trailing 5y excess return, subsequent 12-month excess return, and trailing 5y alpha, independently. We designated the funds with top tertile alpha as high alpha strategies and funds with bottom tertile alpha as low alpha strategies. The transition probability matrix was designed to track the excess return of high-, mid-, and low-ranking performers over subsequent 12-month time periods. The data below showed that strategies with high idiosyncratic alpha had a 22.1% probability of maintaining their top tertile status as opposed to an 18.8% chance of falling to the bottom tertile from the top tertile. For low alpha strategies, the underperformance persistence was much more striking: there was a 27.1% probability that these funds would remain in the bottom tertile in the subsequent 12 months, while the probability for them to rise to the top was only 17%.
14Based on the active strategies trailing 5-year alpha, we divided into five equal-sized groups and computed their average forward 1-year excess return rank for each group.
15U.S. Large Cap active strategies with at least a 36 month track record. Please refer to footnote 5 for rank details.
16Any of three equal groups into which a population can be divided according to the distribution of values of a particular variable.
-
Table 1: U.S. Large Cap Active Strategy17 Excess Return Transition Probability Matrix
Forward 1y performance probability
Low
Mid
High
Population
Trailing 5y performance probability
High Alpha Strategies
Low
4.9%
3.2%
4.1%
Mid
9.5%
9.6%
9.6%
High
18.8%
18.1%
22.1%
Forward 1y performance probability
Low
Mid
High
Population
Trailing 5y performance probability
Low Alpha Strategies
Low
27.1%
17.4%
17.0%
Mid
10.6%
9.0%
7.6%
High
4.6%
3.0%
3.7%
Highest likelihoodLowest likelihoodHypothetical for illustrative purposes only.
Harbor Capital Advisors, as of May 2023.
Small Cap Active18 and Emerging Markets (EM) Active Strategies19
-
While active U.S. Small Cap equity funds outperformed their benchmark in the last 21 years, we find that the negative average idiosyncratic alpha suggests they achieved the positive excess returns with the help from factor tailwinds. On the other hand, active EM managers have struggled both from an excess return and alpha perspective from 2005 to 2022.
Table 2: Historical Performance Statistics
Category
Average Rolling 5Y Return
Average Rolling 5Y Excess Return
Average Rolling 5Y Alpha
Small Cap Active
7.98%
0.49%
-0.55%
Emerging Markets Active
8.66%
-0.49%
-0.84%
Sources: Harbor Capital and FactSet, May 2023
Performance data shown represents past performance and is no guarantee of future results. Returns from Morningstar are all net of fees.
-
Similar to Large Cap active strategies, Small Cap active strategies with higher idiosyncratic alpha also had higher excess returns and higher hit rates. Results for active EM funds, which were based on a much smaller sample size, were mixed. Strategies with higher idiosyncratic alpha had marginally worse average excess returns but slightly better hit rates.
17Refer to the large cap active composition as defined in footnote 5.
18We include all active strategies in Small Cap Blend, Small Cap Growth and Small Cap Value Morningstar categories with at least a 36-month track record for the Small Cap Active manager analysis.
19We include all active strategies in the Emerging Markets Morningstar categories with at least a 36-month track record for the Emerging Markets Active manager analysis.
-
Table 3: Small Cap Active Strategies20 Summary Statistics
Group
Average Alpha
Average 5y Excess Return Hit Rate
Average 5y Excess Return
Median 5y Excess Return
# Strategies
Negative Alpha
-6.0%
36.9%
-1.5%
-0.6%
217
Insignificant
0.1%
46.0%
0.1%
-0.1%
430
Positive Alpha
5.1%
59.4%
1.4%
0.7%
126
All Funds
-0.8%
45.7%
-0.2%
-0.2%
773
Table 4: Emerging Markets Active Strategies21 Summary Statistics
Group
Average Alpha
Average 5y Excess Return Hit Rate
Average 5y Excess Return
Median 5y Excess Return
# Strategies
Negative Alpha
-6.2%
35.1%
-0.9%
-0.8%
117
Insignificant
-0.4%
49.7%
-0.1%
0.1%
112
Positive Alpha
5.2%
39.7%
-0.9%
-0.7%
26
All Funds
-2.5%
42.2%
-0.5%
-0.4%
255
Sources: Harbor Capital and FactSet, May 2023
-
As with Large Cap active strategies, we observed that idiosyncratic alpha had been more successful at forecasting future performance for active EM managers while trailing excess returns were not. However, for Small Cap active managers, it seems neither alpha nor excess return had much forecasting power for future performance.
Performance data shown represents past performance and is no guarantee of future results. Returns from Morningstar are all net of fees.
20We include all active strategies in Small Cap Blend, Small Cap Growth and Small Cap Value Morningstar categories with at least a 36-month track record for the Small Cap Active manager analysis.
21We include all active strategies in the Emerging Markets Morningstar categories with at least a 36-month track record for the Emerging Markets Active manager analysis.
-
Table 5: Average forward 1y excess return category rank22
Category
Signal
1 (lowest)
2
3
4
5
Small Cap Active
Trailing 5y Alpha
48.8%
49.8%
50.5%
50.5%
50.7%
Emerging Markets Active
Trailing 5y Alpha
48.9%
48.8%
51.1%
45.2%
53.1%
Small Cap Active
Trailing 5y Excess Return
50.0%
51.51%
49.8%
50.7%
48.9%
Emerging Markets Active
Trailing 5y Excess Return
50.1%
50.0%
51.4%
48.2%
47.1%
Source: Harbor Capital
-
We found the same persistence in poor performance among low alpha strategies for both Small Cap and Emerging Markets managers, whereas the performance persistence on the positive side proved elusive.
Table 6: Small Cap Active Strategies Transition Probabilities
Forward 1y performance probability
Low
Mid
High
Population
Trailing 5y performance probability
High Alpha Strategies
Low
8.7%
5.6%
6.9%
Mid
10.1%
10.6%
10.0%
High
17.0%
14.4%
16.7%
Forward 1y performance probability
Low
Mid
High
Population
Trailing 5y performance probability
Low Alpha Strategies
Low
21.8%
13.6%
15.8%
Mid
10.3%
11.5%
9.0%
High
7.1%
5.7%
5.3%
Highest likelihoodLowest likelihoodSources: Harbor Capital and FactSet, May 2023. Hypothetical for illustrative purposes only.
22To assess the relationship between idiosyncratic alpha and potential future performance, we ran a yearly back test, where we divided strategies into quintiles based on their trailing 5y idiosyncratic alpha and examined the average forward 1y excess return rank for each quintile. In our assessment of the data, strategies with the highest idiosyncratic alpha performed the best in the subsequent 12 months, while strategies with the lowest idiosyncratic alpha performed the worst. However, if we ranked strategies by their trailing excess return instead, there was little differentiation in future performance among quintiles.
-
Table 7: Emerging Markets Active Strategies Transition Probabilities
Forward 1y performance probability
Low
Mid
High
Population
Trailing 5y performance probability
High Alpha Strategies
Low
10.2%
5.5%
7.4%
Mid
8.9%
9.9%
10.5%
High
15.8%
14.0%
17.7%
Forward 1y performance probability
Low
Mid
High
Population
Trailing 5y performance probability
Low Alpha Strategies
Low
19.7%
13.4%
13.4%
Mid
10.8%
11.3%
10.3%
High
8.6%
6.2%
6.6%
Highest likelihoodLowest likelihoodSource: Harbor Capital and FactSet, May 2023
Performance data shown represents past performance and is no guarantee of future results. Returns from Morningstar are all net of fees. Hypothetical for illustrative purposes only.
Conclusion
Investors often use a fund’s past performance to understand the strategy and develop their expectations for future performance. Our research suggests that a fund’s idiosyncratic alpha may be a better performance metric than excess return in evaluating manager skills. Although we found that a fund’s historical excess return and its idiosyncratic alpha during the same period were highly correlated, the fund’s future performance depended more on the manager’s proven ability to generate idiosyncratic alpha. It is difficult for active managers to outperform persistently, potentially because alpha tends to diminish as fund’s outperformance attracts more capital inflows. However, from our analysis, a low alpha fund’s underperformance tends to be sticky.
Important Information
Performance data shown represents past performance and is no guarantee of future results.
For Institutional Use Only. Not for Distribution to the Public.
The views expressed herein are those of Harbor Capital Advisors, Inc. investment professionals at the time the comments were made. They may not be reflective of their current opinions, are subject to change without prior notice, and should not be considered investment advice. The information provided in this presentation is for informational purposes only.
This material does not constitute investment advice and should not be viewed as a current or past recommendation or a solicitation of an offer to buy or sell any securities or to adopt any investment strategy.
Investing entails risks and there can be no assurance that any investment will achieve profits or avoid incurring losses. Stock markets are volatile and equity values can decline significantly in response to adverse issuer, political, regulatory, market and economic conditions. Investing in international and emerging markets poses special risks, including potentially greater price volatility due to social, political and economic factors, as well as currency exchange rate fluctuations. These risks are more severe for securities of issuers in emerging market regions. Stocks of small cap companies pose special risks, including possible illiquidity and greater price volatility than stocks of larger, more established companies.
HYPOTHETICAL PERFORMANCE RESULTS HAVE MANY INHERENT LIMITATIONS, SOME OF WHICH ARE DESCRIBED BELOW. NO REPRESENTATION IS BEING MADE THAT ANY ACCOUNT WILL OR IS LIKELY TO ACHIEVE PROFITS OR LOSSES SIMILAR TO THOSE SHOWN. IN FACT, THERE ARE FREQUENTLY SHARP DIFFERENCES BETWEEN HYPOTHETICAL PERFORMANCE RESULTS AND THE ACTUAL RESULTS SUBSEQUENTLY ACHIEVED BY ANY PARTICULAR TRADING PROGRAM.
ONE OF THE LIMITATIONS OF HYPOTHETICAL PERFORMANCE RESULTS IS THAT THEY ARE GENERALLY PREPARED WITH THE BENEFIT OF HINDSIGHT. INADDITION, HYPOTHETICAL TRADING DOES NOT INVOLVE FINANCIAL RISK, AND NO HYPOTHETICAL TRADING RECORD CAN COMPLETELY ACCOUNT FOR THE IMPACT OF FINANCIAL RISK IN ACTUAL TRADING.FOR EXAMPLE, THE ABILITY TO WITHSTAND LOSSES OR TO ADHERE TO A PARTICULAR TRADING PROGRAM IN SPITE OF TRADING LOSSES ARE MATERIAL POINTS WHICH CAN ALSO ADVERSELY AFFECT ACTUAL TRADING RESULTS. THERE ARE NUMEROUS OTHER FACTORS RELATED TO THE MARKETS IN GENERAL OR TO THE IMPLEMENTATION OF ANY SPECIFIC TRADING PROGRAM WHICH CANNOT BE FULLY ACCOUNTED FOR IN THE PREPARATION OF HYPOTHETICAL PERFORMANCE RESULTS AND ALL OF WHICH CAN ADVERSELY AFFECT ACTUAL TRADING RESULTS.
Historical performance data starts from 12/2001 to 12/2022 for U.S. Large Cap and U.S. Small Cap, and it starts from 12/2005 to 12/2022 for Emerging Markets.
We measure consistency by the t-statistics of a strategy’s monthly rolling 5y idiosyncratic alpha. If the t-stats is greater than 1.69, the strategy has consistently generated positive alpha; if the t-stats is lower than -1.69, the strategy has consistently generated negative alpha; if the t-stats is between -1.69 and 1.69, the alpha the strategy has generated is insignificant. We require at least 36 months of return data for a strategy to calculate idiosyncratic alpha, and we require at least 36 alpha data points to calculate t-statistics.
Alpha is a measure of risk (beta)-adjusted return.
Basis points (bps) are a unit of measure used in finance to describe the percentage change in the value of financial instruments or the rate change in an index or other benchmark.
Idiosyncratic Alpha is the portion of a strategy’s return not explained by the market and risk factors.
Tertile is any of three equal groups into which a population can be divided according to the distribution of values of a particular variable.
Harbor Capital Advisors, Inc.
3079565


