Contact
Mapping the Business Cycle
Harbor Multi-Asset Solutions: Q1 2025
February 05, 2025


Macro Landscape: Q1 2025
The U.S. economy finds itself in an enviable position at the forefront of the A.I. boom coupled with robust growth, full employment, and slowing inflation. Meanwhile, economic prospects abroad look dim. Europe remains on the precipice of a more severe growth slowdown, while China confronts a liquidity trap.
The U.S. economy’s privileged position is reflected in high relative valuations for U.S. assets and brimming confidence that U.S. outperformance can continue as it has for much of the last 15 years.
One assumption underlying this optimism is that the stimulative aspects of President Trump’s agenda like deregulation and tax cuts can more than offset the risks posed by higher tariffs and reduced immigration.
Another is that headline inflation is set to approach 2 percent by the middle of 2025 as services prices decelerate alongside the slowdown in wage growth. Core inflation will remain elevated, though likely to still come down.
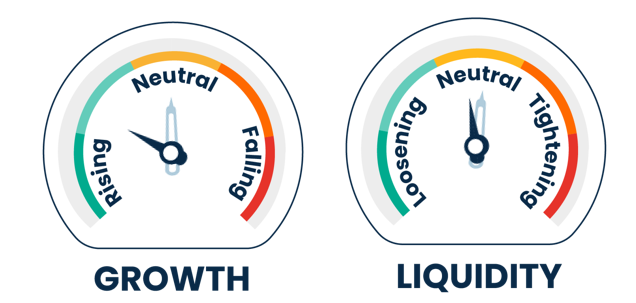
In line with these assumptions, we remain in a late-cycle regime with favorable risk-seeking dynamics as the U.S. continues to be the best bet globally. However, risk-reward is less favorable from here given elevated equity valuations and sentiment.
We retain our overweight to U.S. equities, albeit in smaller size. Conversely, we are increasing our allocation to fixed income as yields embed lofty growth and deficit expectations, despite narrow congressional majorities that will complicate delivering major pro-cyclical stimulus. Gold remains a diversifier in case inflation remains high or U.S. fiscal sustainability concerns magnify; gold will also experience tailwinds if the Fed delivers additional cuts in 2025.

Tactical Asset Allocation & Market Themes
| Unconstrained vs. 60/40 | Chg | Underweight | Neutral | Overweight | Rationale |
| Portfolio Risk (Beta, Relative Vol) | • | Retain equity overweight as U.S. economic growth remains strong, inflation has improved, central banks cutting rates | |||
| Portfolio Duration | • | Move duration closer to neutral with continued progress on inflation and rate cut expectations aligned with the market | |||
| Equities (ACWI) | • | Late cycle regime with positive market sentiment has typically been a favorable environment for equities | |||
| U.S. Large Cap | • | Higher profitability of U.S. large cap companies has been attractive in a late cycle environment | |||
| US SMID Cap | • | Valuations appear attractive but maintain neutral positioning due to low quality nature in the aggregate | |||
| Western Europe | • | Growth remains tepid, central banks have begun tocut rates; UK appears cheap with improving growth outlook | |||
| Japan | ↓ | • | |||
| Emerging Markets | • | Valuations appear attractive, but awaiting more policy certainty as weak confidence and property remain headwinds | |||
| Equity Styles1 | |||||
| Value | • | Selectively leaning into attractive value sectors, but overall tight value spreads have been a headwind to the style | |||
| Growth | • | Beneficiary of peak rates & inflation; however, valuations have normalized and thus we prefer quality/GARP | |||
| Quality | • | Favor companies that maintain pricing power, generate high levels of profitability and are reasonably valued | |||
| Low Vol | • | We believe it is still too early to lean into defensives given the broader resilience of the economy | |||
| Fixed Income (Barc Agg) | • | Fixed income offers attractive real yield but risk/reward still favors equities | |||
| Treasury | • | Underweight treasuries as we view market expectations for the pace and magnitude of rate cuts as reasonable | |||
| IG | • | IG remains rich, prefer equities for market beta exposure | |||
| MBS | ↑ | • | Move to neutral as valuation gap to IG has widened amid the rates selloff | ||
| Credit (Non Agg) | • | Credit spreads appear to be approaching the floor, but difficult to forgo income in late-cycle regime | |||
| HY Bonds | • | HY offers low risk premia, however, carry appears to be an attractive factor in a benign macro environment | |||
| EMD | ↓ | • | EM debt faces additional risks from tariffs and China’s liquidity trap | ||
| Loans | • | Prefer incremental duration exposure provided by HY given equity overweight | |||
| Commodities | • | Gold offers diversification benefits; we expect supply deficits in 2H 2024 for energy | |||
| Precious Metals | • | Official investors accumulating gold reserves while others seek inflation-protection; strong diversification potential | |||
| Ind Metals, Agg, Energy | • | Chinese stimulus not yet a gamechanger for commodity consumption | |||
| Cash (T-Bills) | • | Cash offers an attractive yield, although we expect duration to diversify soon as inflation recedes |
1 Overall "equity styles" cannot be o/w or u/w, only individual equity styles
For hypothetical illustrative purposes only. This information should not be considered as a recommendation to purchase or sell a particular security. Source: Harbor MAST; Positioning as of December 2024.
Business Cycle: Growth Conditions (G)
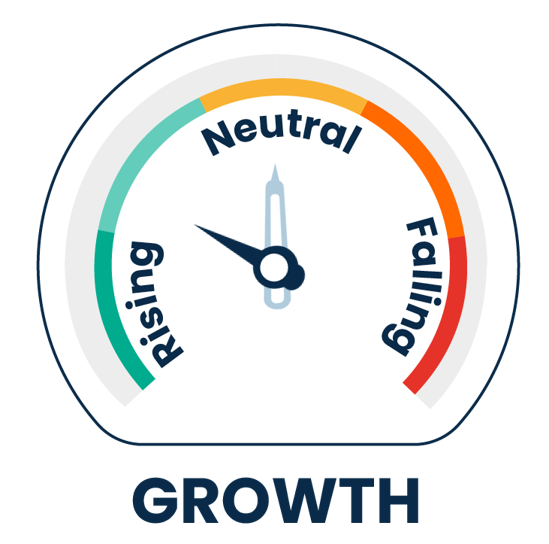
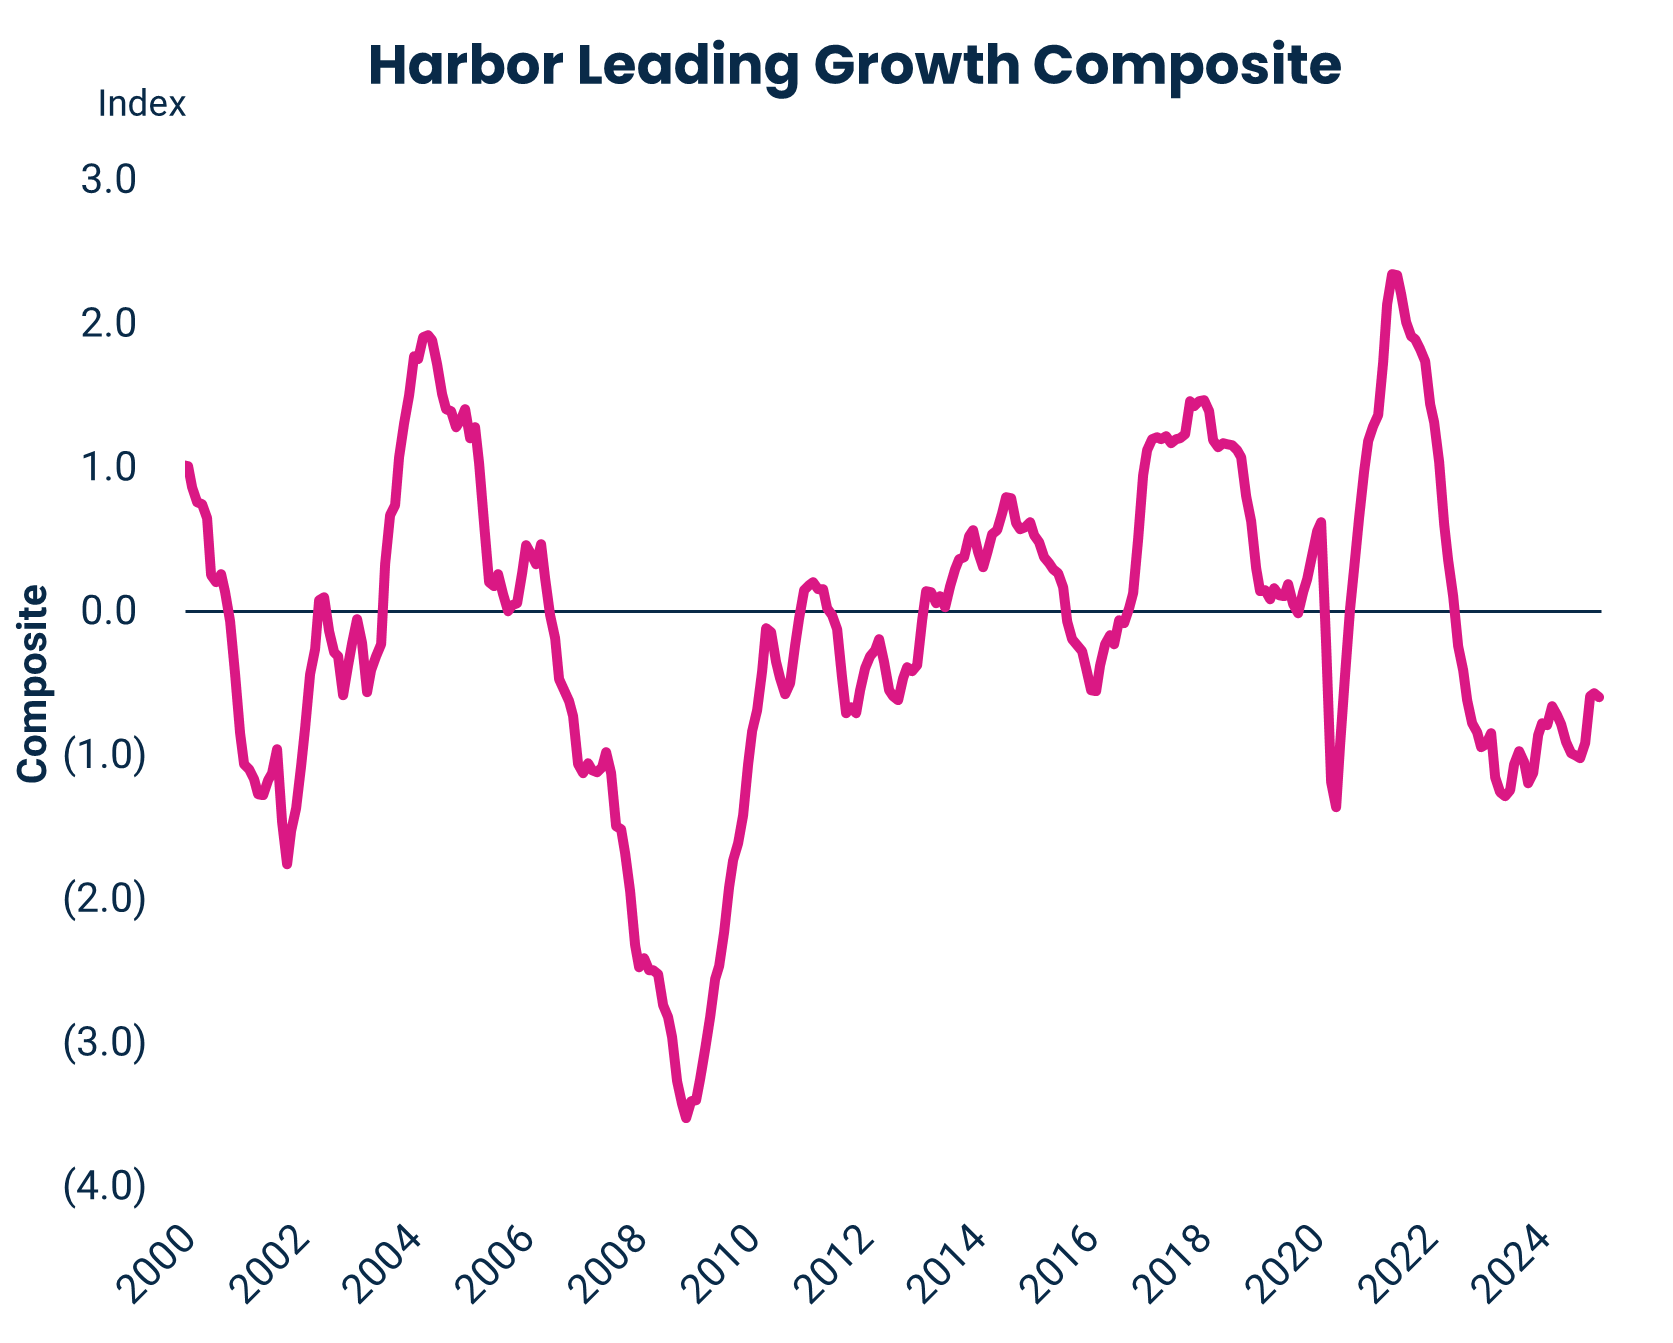
Prior to the election, full employment, immigration, high household net worth, and healthy productivity growth powered GDP growth of around 3 percent. The election catalyzed a material increase in consumer and business sentiment amid hopes of tax cuts and deregulation.
We think the net effect of the new administration’s policies will prove stimulative. However, already declining immigration and labor supply growth prior to the election may dampen any positive impulse from pro-cyclical tax and regulatory policies on the pace of GDP growth.
The new administration also offers clear downside risks. First, larger deficit spending may sow the seeds of its own destruction if financial markets deem the path unsustainable akin to the U.K.’s budget crisis in 2022. Second, tariffs are a signature policy that rests with the executive branch where early action could derail the positive effects of the rest of the agenda.
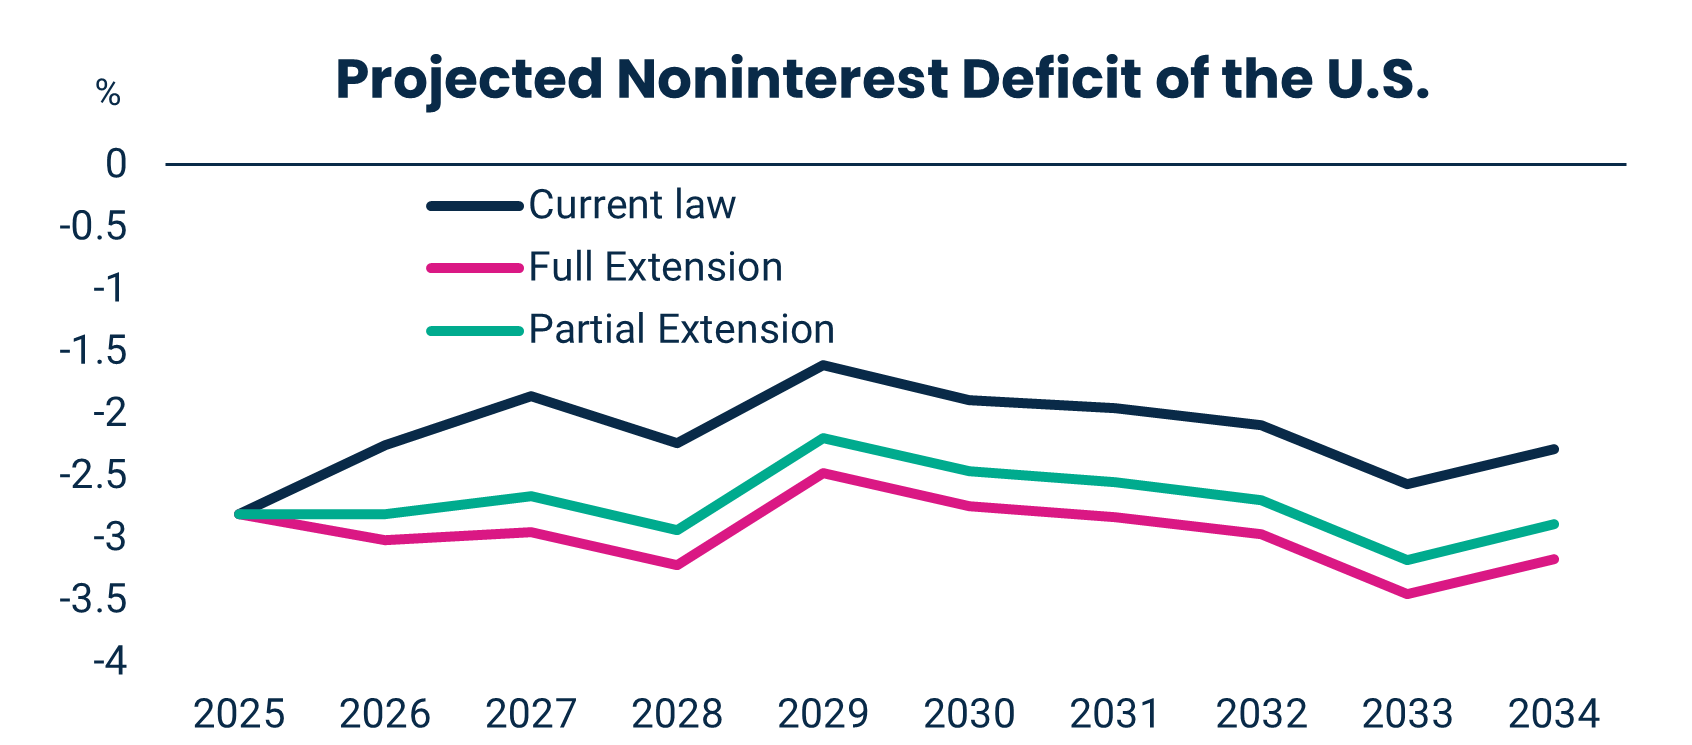

For more information about Harbor's indicators and models, please see the end of this document. For hypothetical and illustrative purposes only. This information should not be considered as a recommendation to purchase or sell a particular security. Sources: Harbor MAST, Bloomberg L.P., Conference Board, Yale Budget Lab; Data as of December 2024.
Business Cycle: Liquidity Conditions (L)
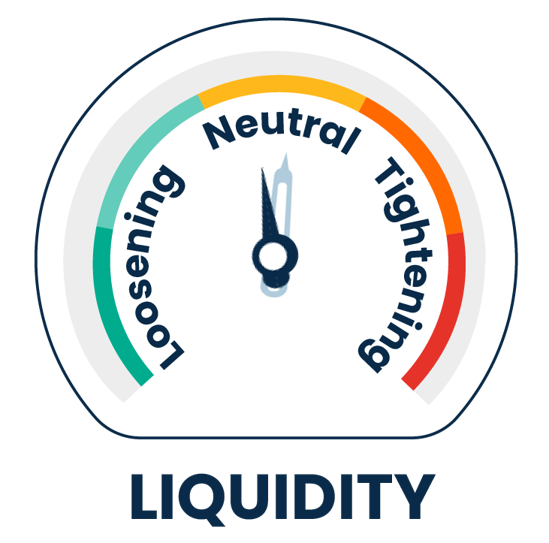
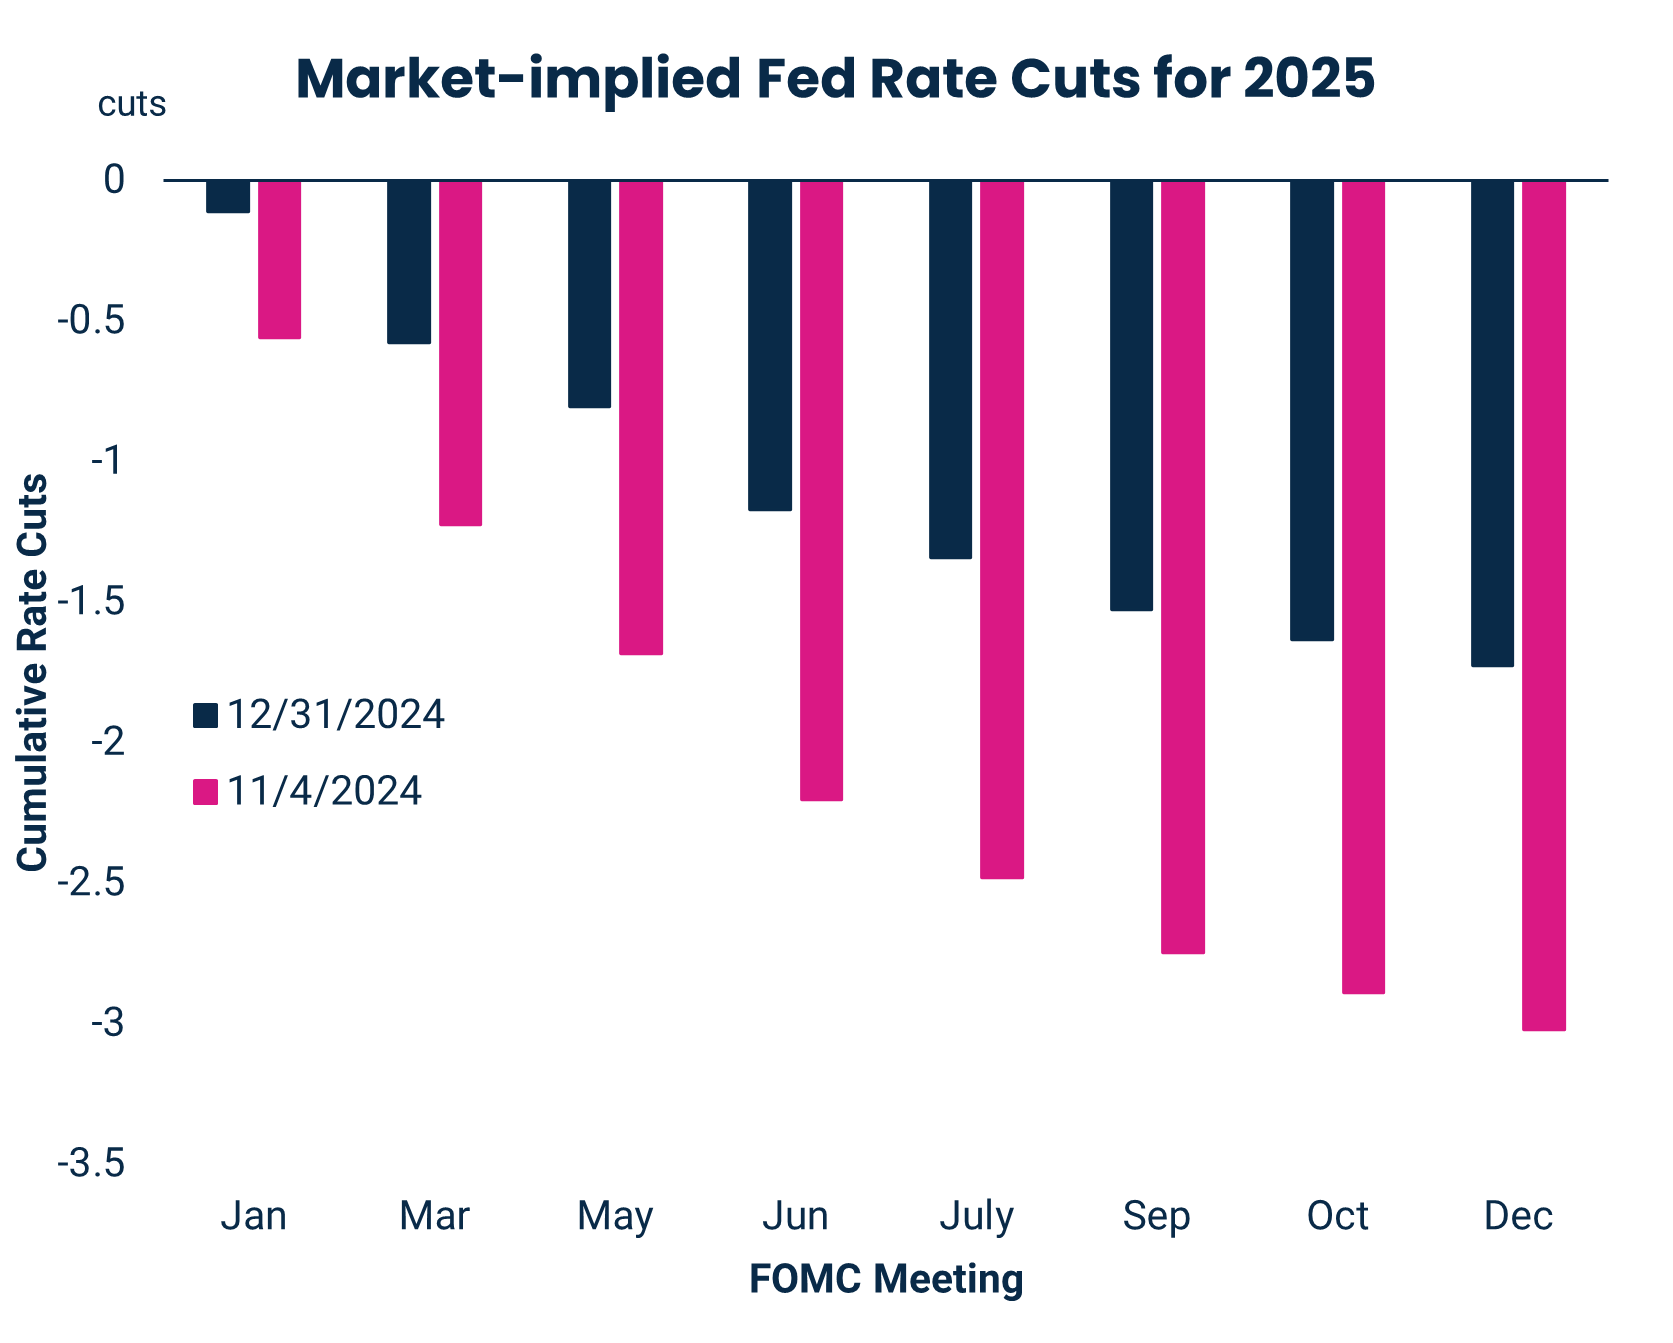
After 100 basis points of interest rate cuts to close out 2024, the December FOMC meeting acknowledged that rate cuts are no longer foregone conclusions at upcoming meetings.
The shift in rhetoric from Chair Powell and the Committee reflected the uncertainty surrounding both the terminal rate this cycle and the policies of the new administration.
Despite Committee members’ steadfast assertions that rates remained in restrictive territory in 2024, the resilience of the U.S. economy in the face of high rates raised doubts.
Fiscal policy and tariff decisions will dictate whether the FOMC delivers on the two additional rate cuts priced in markets. We think risk skews towards more rather than fewer rate cuts with markets underestimating the likelihood of tariffs while overestimating the impact of tax cuts as an offset for growth.

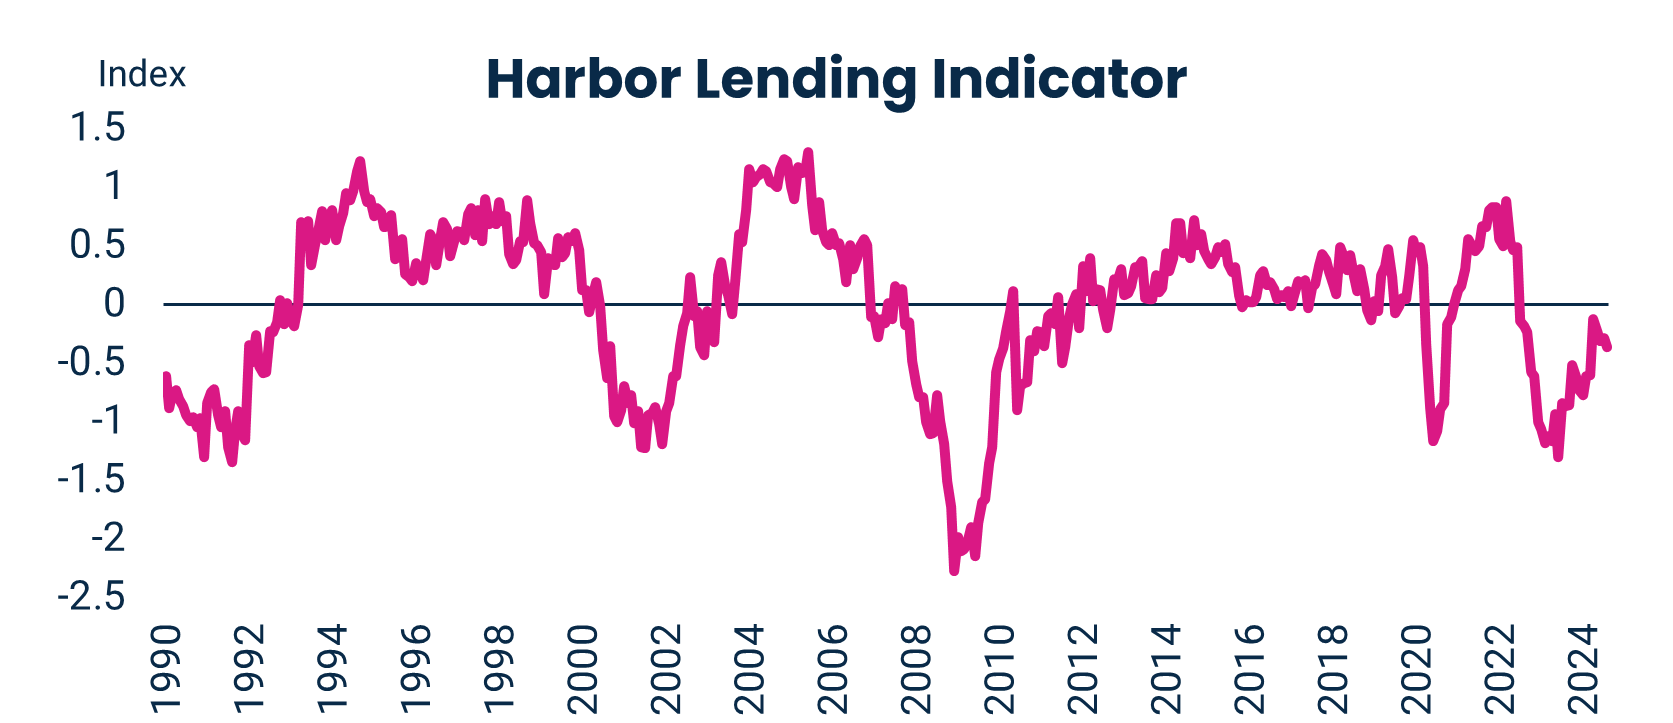
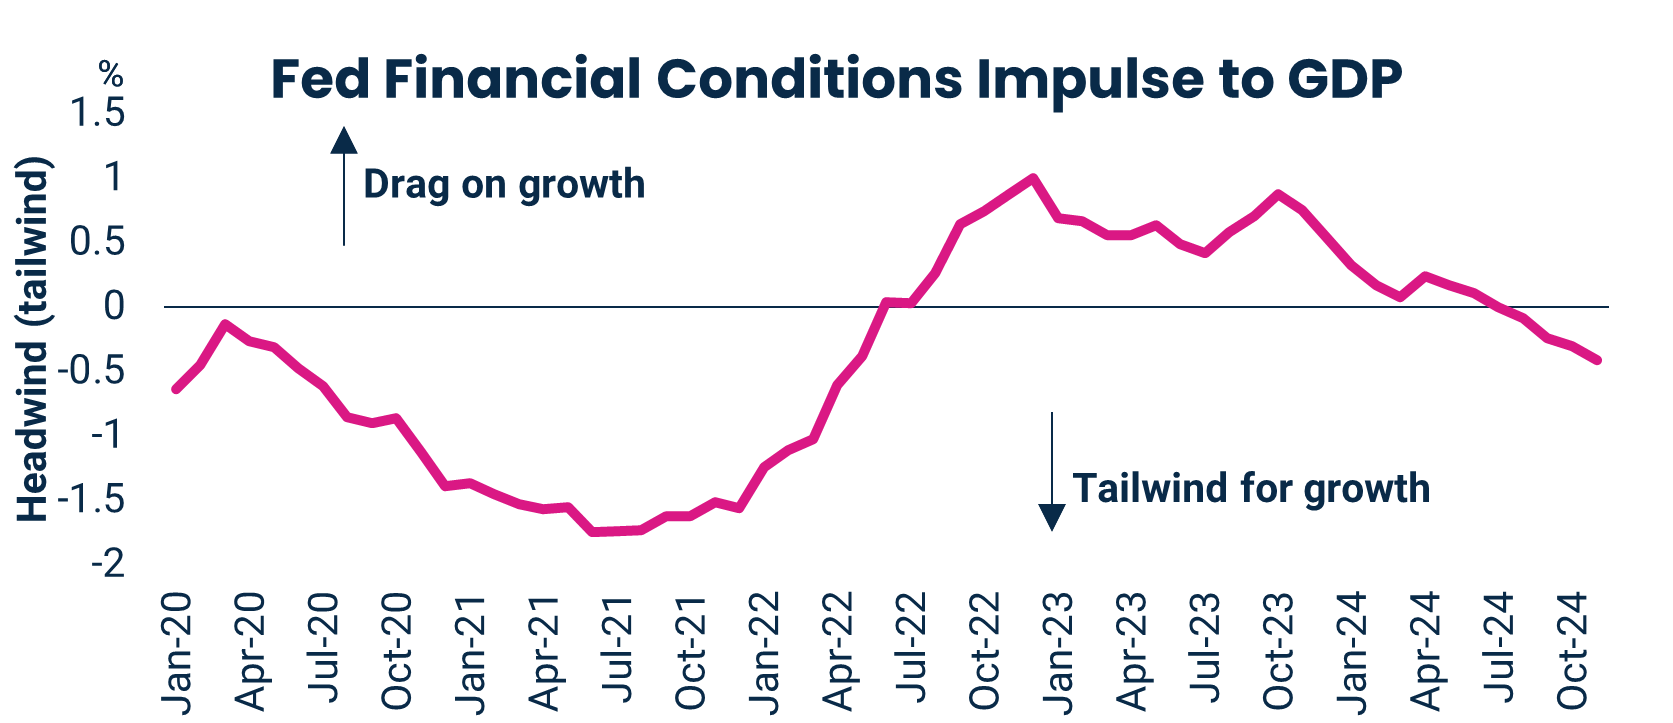
For more information about Harbor's indicators and models, please see the end of this document. For hypothetical and Illustrative purposes only. This information should not be considered as a recommendation to purchase or sell a particular security. Sources: Harbor MAST, Bloomberg L.P.; Data as of December 2024
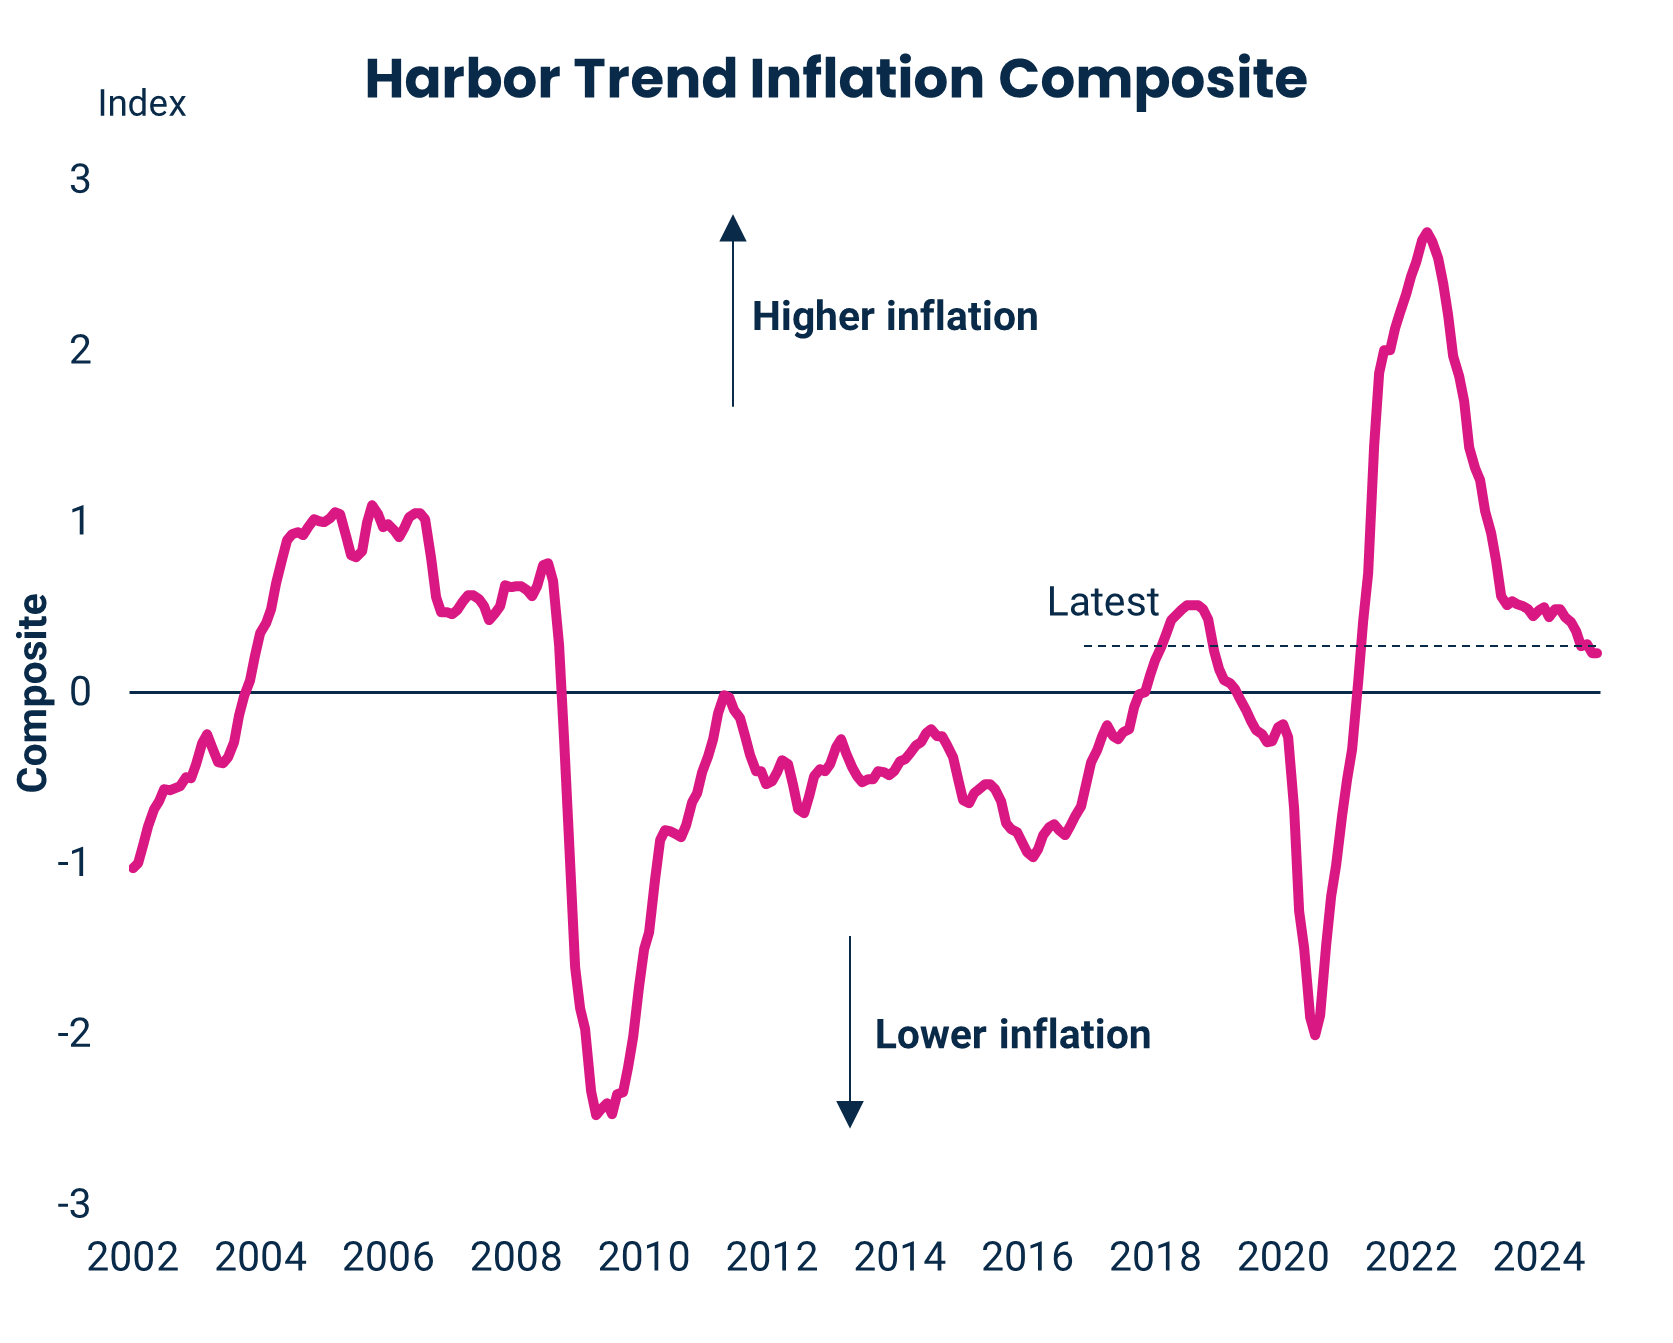
Business Cycle: Inflation Conditions (I)
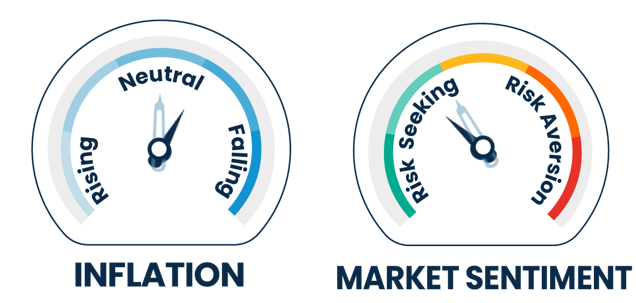
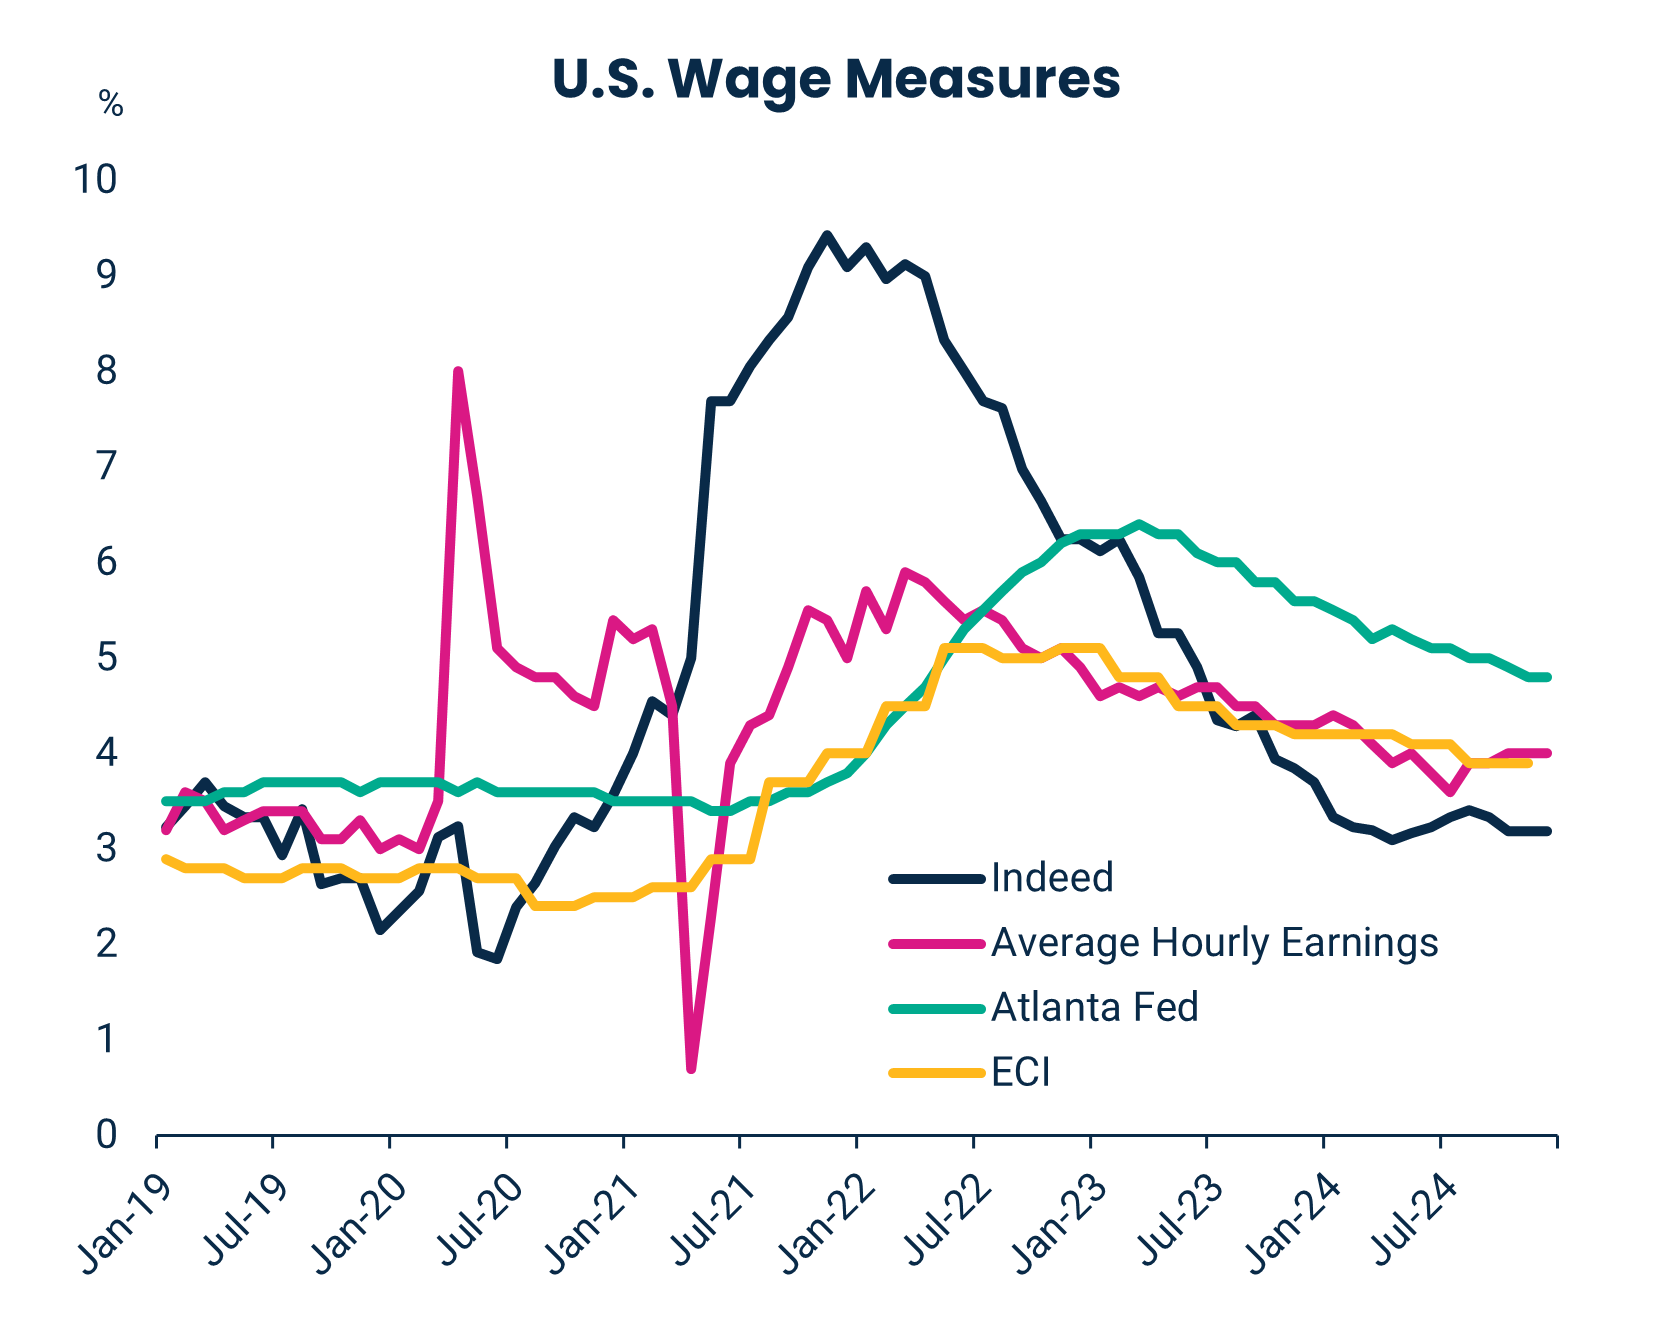
Measures of trend inflation indicate that services ex. shelter remains the only subsector of inflation meaningfully above its pre-COVID trend.
Whether or not services inflation will return to trend depends on wage developments. While nominal wages remain above pre-COVID levels, higher productivity and the effects of delayed bargaining account for some of the gap.
We expect that anchored inflation expectations and the gradual easing in the labor market over the last year are enough to close the gap.
Higher tariffs pose an upside risk to inflation; however, in most scenarios, the total effect on inflation should not derail a return to 2 percent inflation by 2026 nor Fed policy.
For more information about Harbor's indicators and models, please see the end of this document. For hypothetical and illustrative purposes only. This information should not be considered as a recommendation to purchase or sell a particular security. Sources: Harbor MAST, Bloomberg L.P., BLS, Federal Reserve Bank of Atlanta, Indeed. Data as of December 2024.
Market Sentiment

Post-election, market sentiment surged due to expectations of a pro-business environment.
As the rising tide is lifting most assets, some industry groups like crypto and banks are showing early signs of excess; however, we do not yet see worrying signs of excess euphoria more broadly.
The high valuations and buoyant sentiment we see today is raising our antennae a bit as history suggests this combination is a recipe for disappointment if fundamentals underdeliver.


For more information about Harbor's indicators and models, please see the end of this document. For hypothetical and illustrative purposes only. This information should not be considered as a recommendation to purchase or sell a particular security. Sources: Harbor MAST, Data as of December 2024.
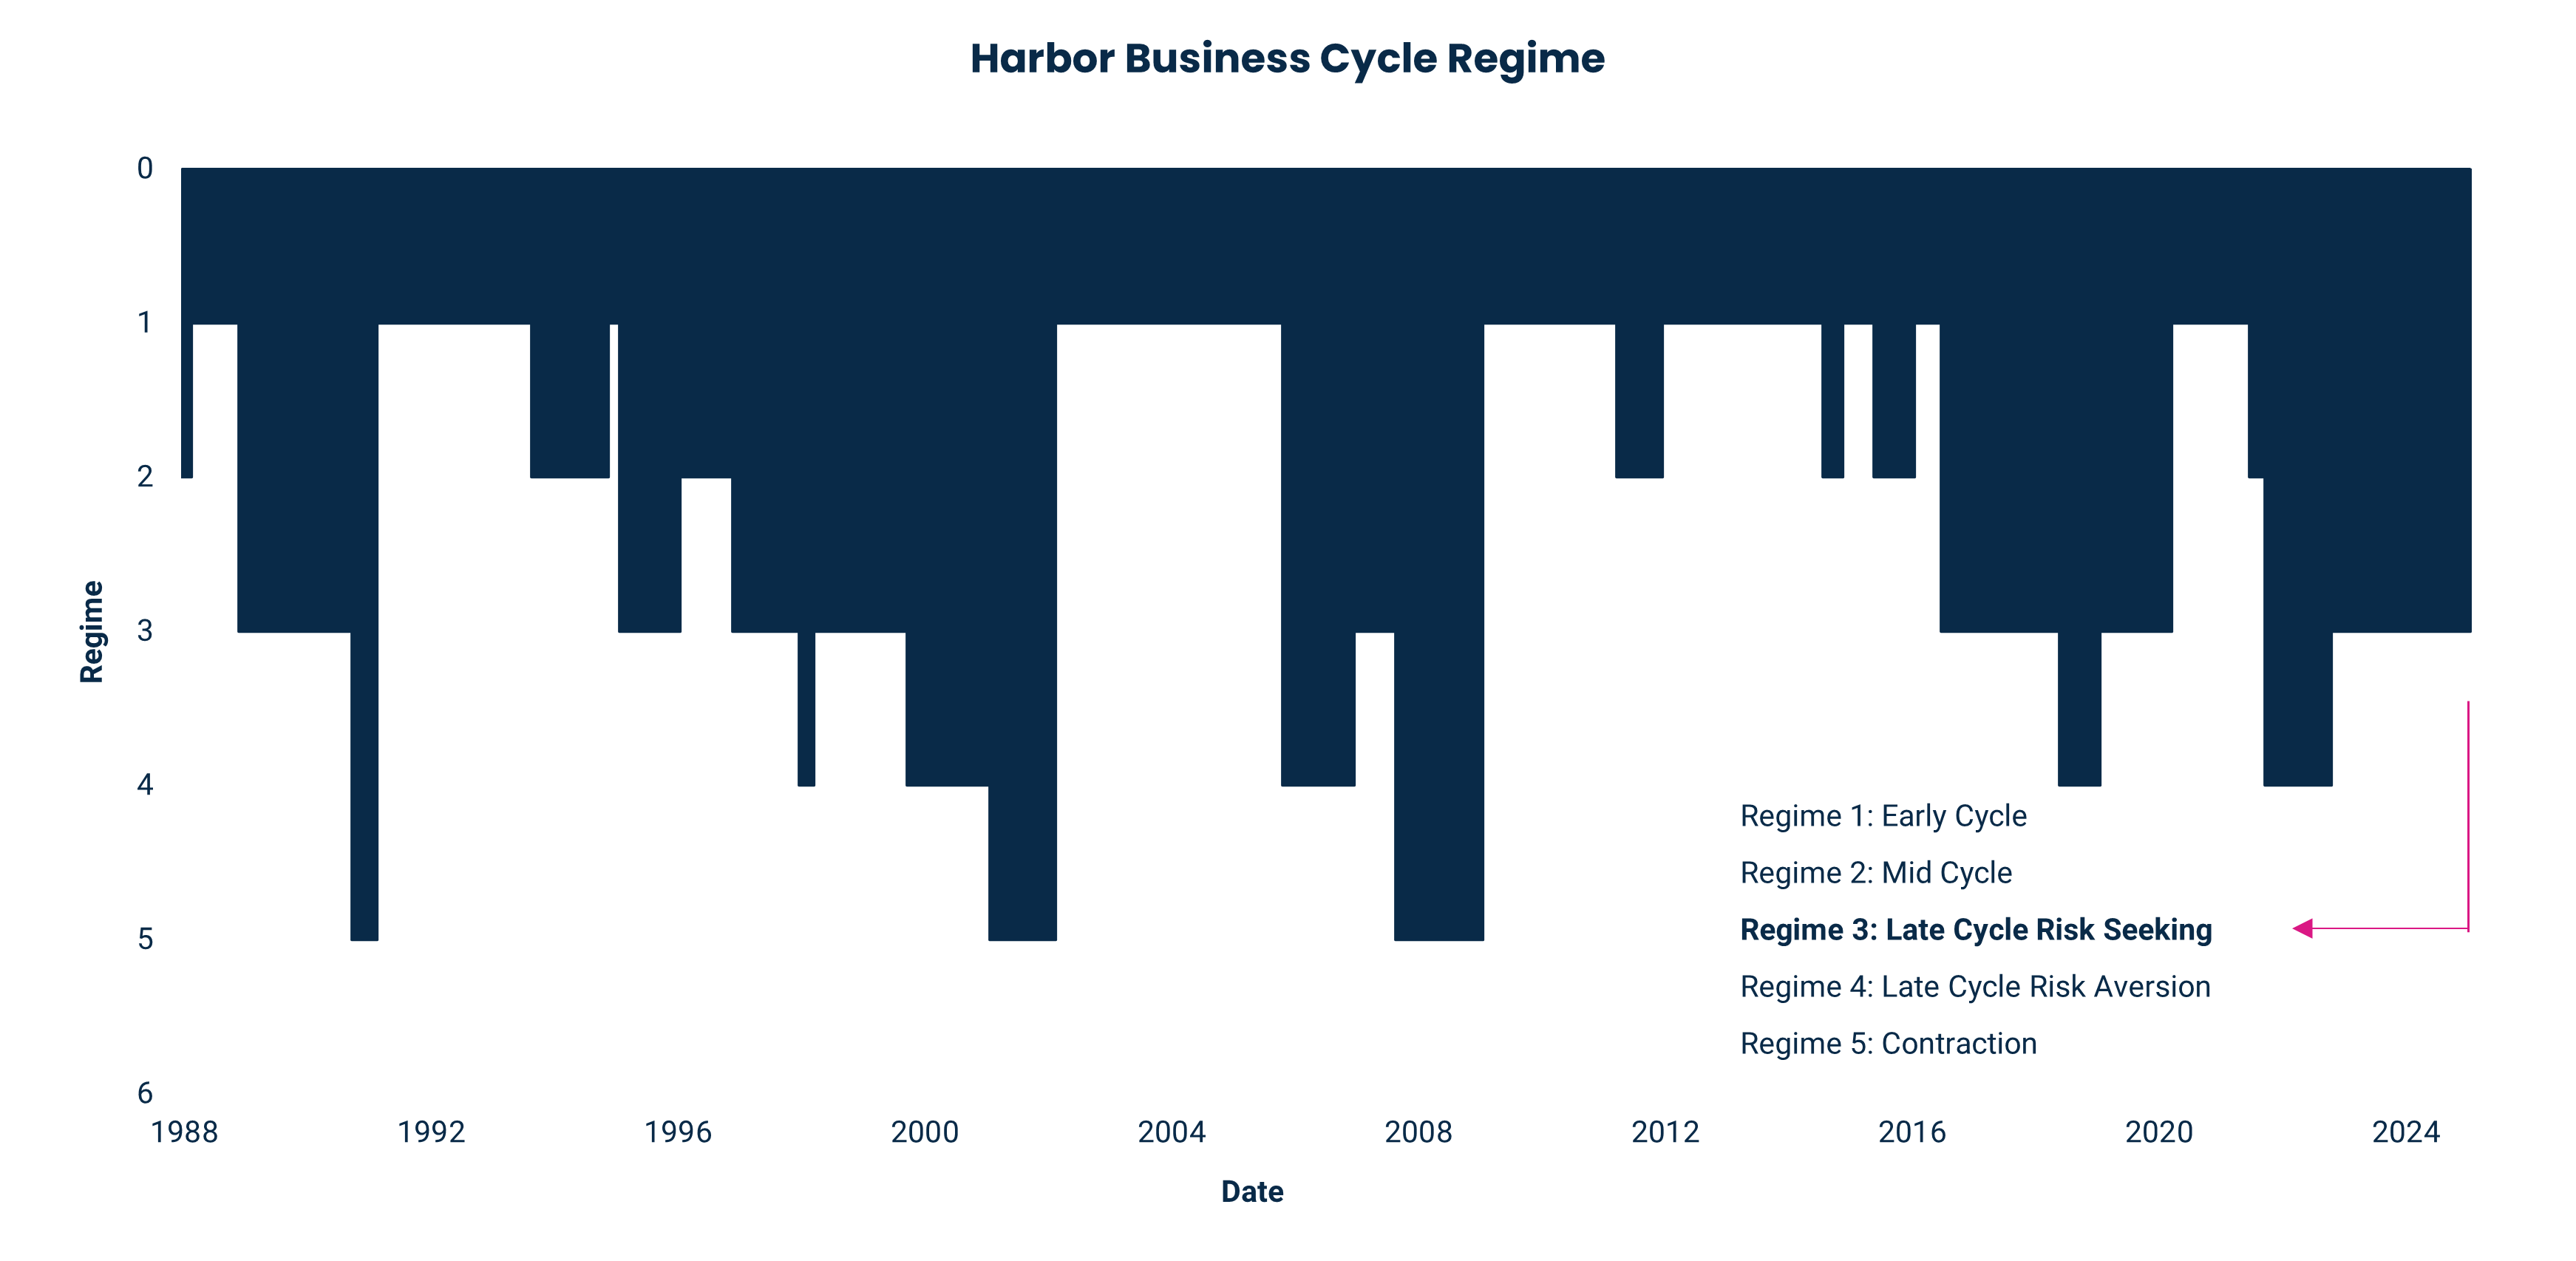
GLI + Market Sentiment = Business Cycle Regime
Our Business Cycle model indicates that the U.S. economy is in a late-cycle environment with risk seeking sentiment. This regime is generally favorable for equities and risk assets.
The U.S. economy is robust, capital allocators whether investors or company executives are optimistic, and the Fed retains ample policy space to respond to any unforeseen shock.

For more information about Harbor's indicators and models, please see the end of this document. For hypothetical and illustrative purposes only. “GLI” stands for Growth, Liquidity and Inflation. This information should not be considered as a recommendation to purchase or sell a particular security. Sources: Harbor MAST, Bloomberg L.P. Data as of December 2024.
Equities: Can the U.S. Outperform Again?
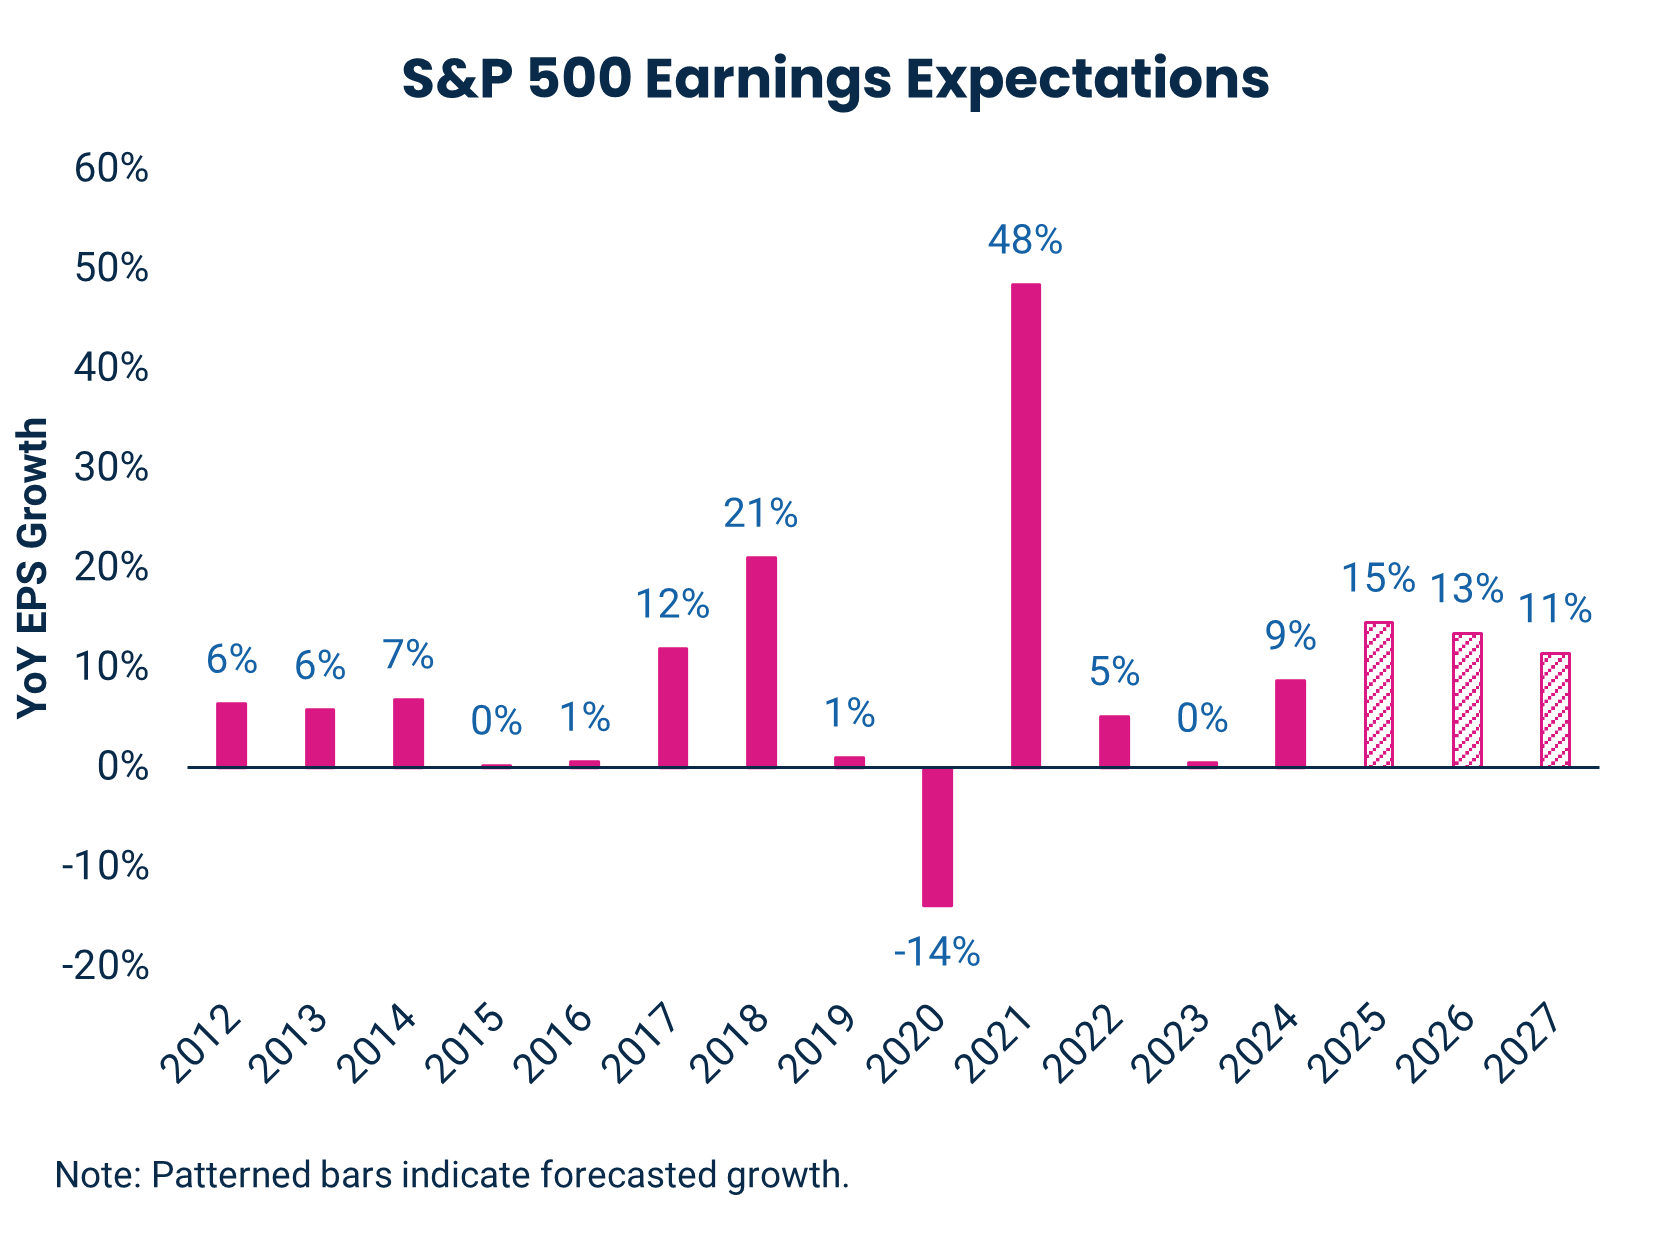
The U.S. achieved a rare feat with a second consecutive year of >20% gains in 2024 on the back of robust economic growth, corporate earnings growth of nearly 10%, and enthusiasm for A.I.-exposed companies.
With a higher multiple accounting for almost half of last year’s gain, U.S. equities face a higher hurdle in 2025. If realized, earnings growth forecasts support this higher multiple with earnings expected to grow by more than 10% each year through 2027.
This mix of a high valuation and earnings growth estimates well above U.S. nominal growth imply some combination of efficiency gains and policy help, whether regulatory or through tax changes.
The risk is that U.S. equity market outperformance is becoming a truism at a time when ex. U.S. valuations remain low. Mindful of that, we want a U.S. equity overweight as we believe elevated multiples are largely justified from strong EPS growth, high profit margins, strong returns on equity, and historically high returns of capital through share buybacks and dividends; so long as these trends persist and the economic expansion remains in-tact, U.S. equity multiples should remain elevated.
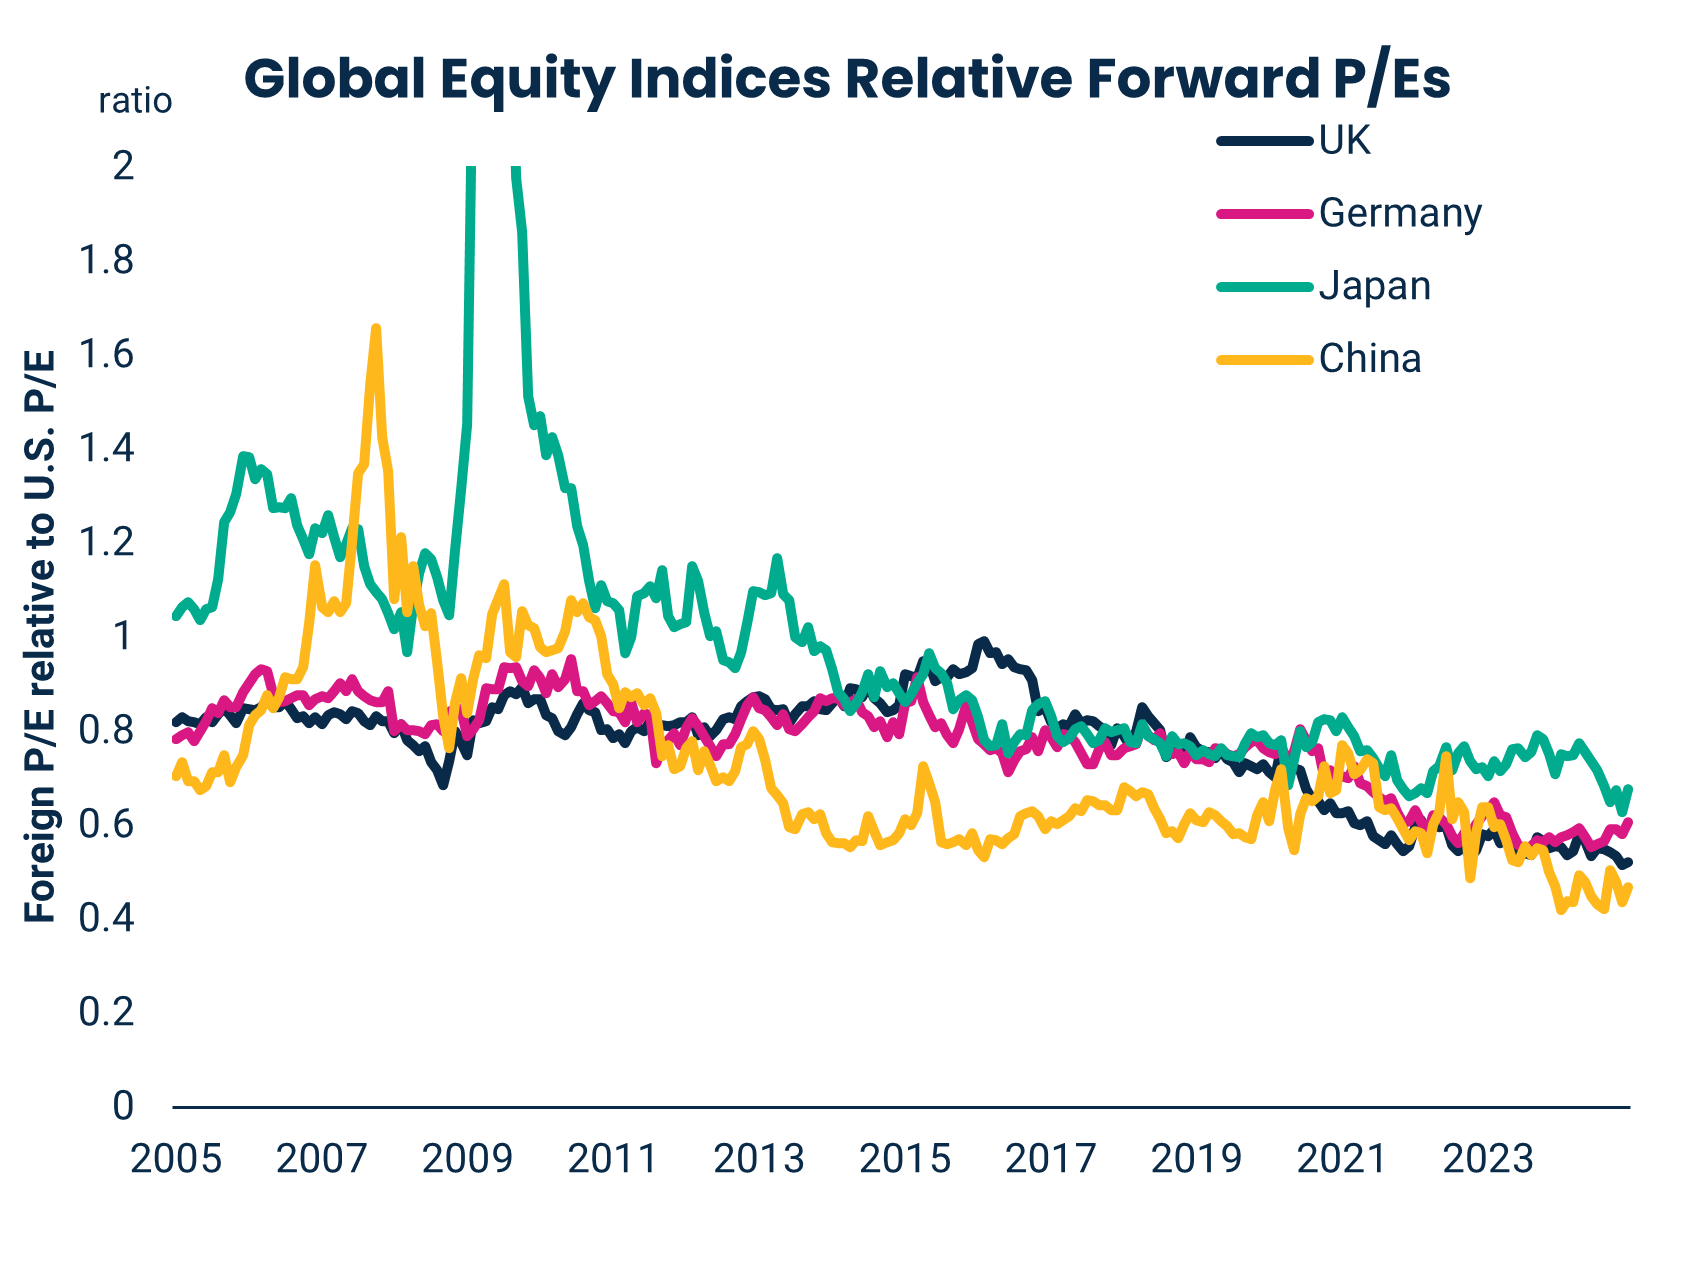
For more information about Harbor's indicators and models, please see the end of this document. For hypothetical and illustrative purposes only. Past performance does not guarantee future results. Forecast and estimates are based on hypothetical assumptions and for informational purposes only. The S&P 500 Index is an unmanaged index generally representative of the U.S. market for large capitalization equities. This unmanaged index does not reflect fees and expenses and is not available for direct investment. This information should not be considered as a recommendation to purchase or sell a particular security. Sources: Harbor MAST, FactSet, MSCI, Bloomberg L.P. Global equity indices relative forward P/Es based on respective MSCI indices. Data as of December 2024.
Rates: From Too High to High Enough
The outlook for rates turns on two interrelated questions: how stimulative will Trump 2.0 prove to be; and how stimulative is Fed policy currently.
Model estimates find higher risk premia explains some of the runup in rates to close 2024. More policy uncertainty, whether from tariffs or fiscal policy, widens the distribution of outcomes for rates and, with it, the compensation to bear it.
The market-implied Fed policy path was revised higher as well to end the year. Even prior to the election results, the resilience of the U.S. economy and inflation, despite high front-end interest rates, undermined the case for additional rate cuts.
However, we find interest rates attractive at current levels as the embedded growth and policy assumptions are too optimistic. Nevertheless, the path to lower rates will be bumpy given persistent headline risk from the new administration in 2025.

For more information about Harbor's indicators and models, please see the end of this document. For hypothetical and illustrative purposes only. This information should not be considered as a recommendation to purchase or sell a particular security. Sources: Harbor MAST, Bloomberg L.P. Data as of December 2024.
Commodities: Time for Cyclicals?
Cyclical commodities like copper and petroleum products struggled in 2024 as economic growth outside of the U.S., particularly in China, fell short of expectations.
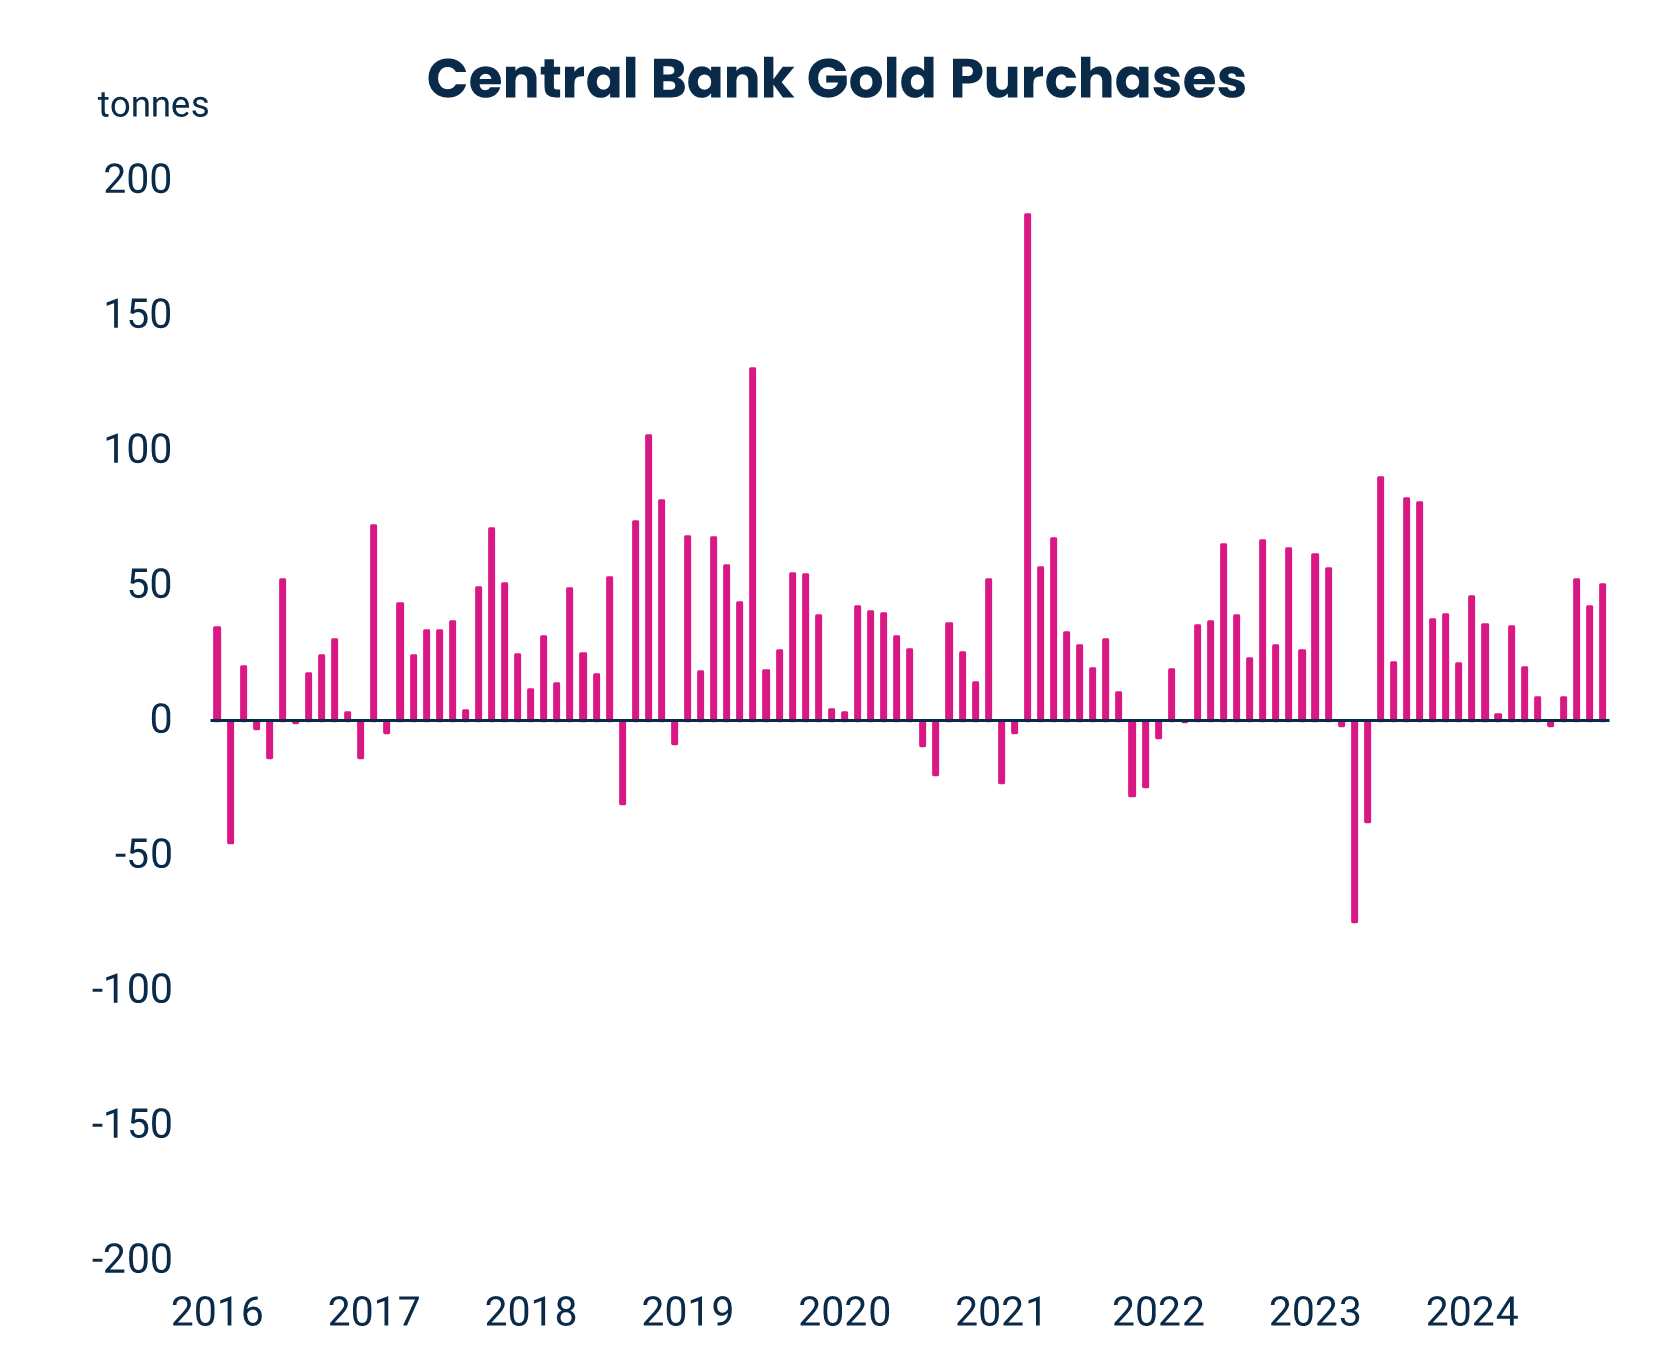
Gold prices increased 27%, the largest since 2010, as central banks added to gold holdings at a fast pace, a trend that started after Russia’s reserves were effectively seized following the invasion of Ukraine in 2022. The global cutting cycle has been another tailwind for gold.
We expect the late-cycle environment in the U.S. to persist putting a floor under cyclical commodities, but the ceiling is limited as we expect China’s stimulus measures to stabilize rather than supersize economic growth. Moreover, outside of certain metals key to electrification like copper and some agricultural markets, inventories and latent supply can offset unexpected demand in many consumable commodity markets.
We remain bullish on gold over the long-term with geopolitical tensions being a persistent feature of the 2020s.
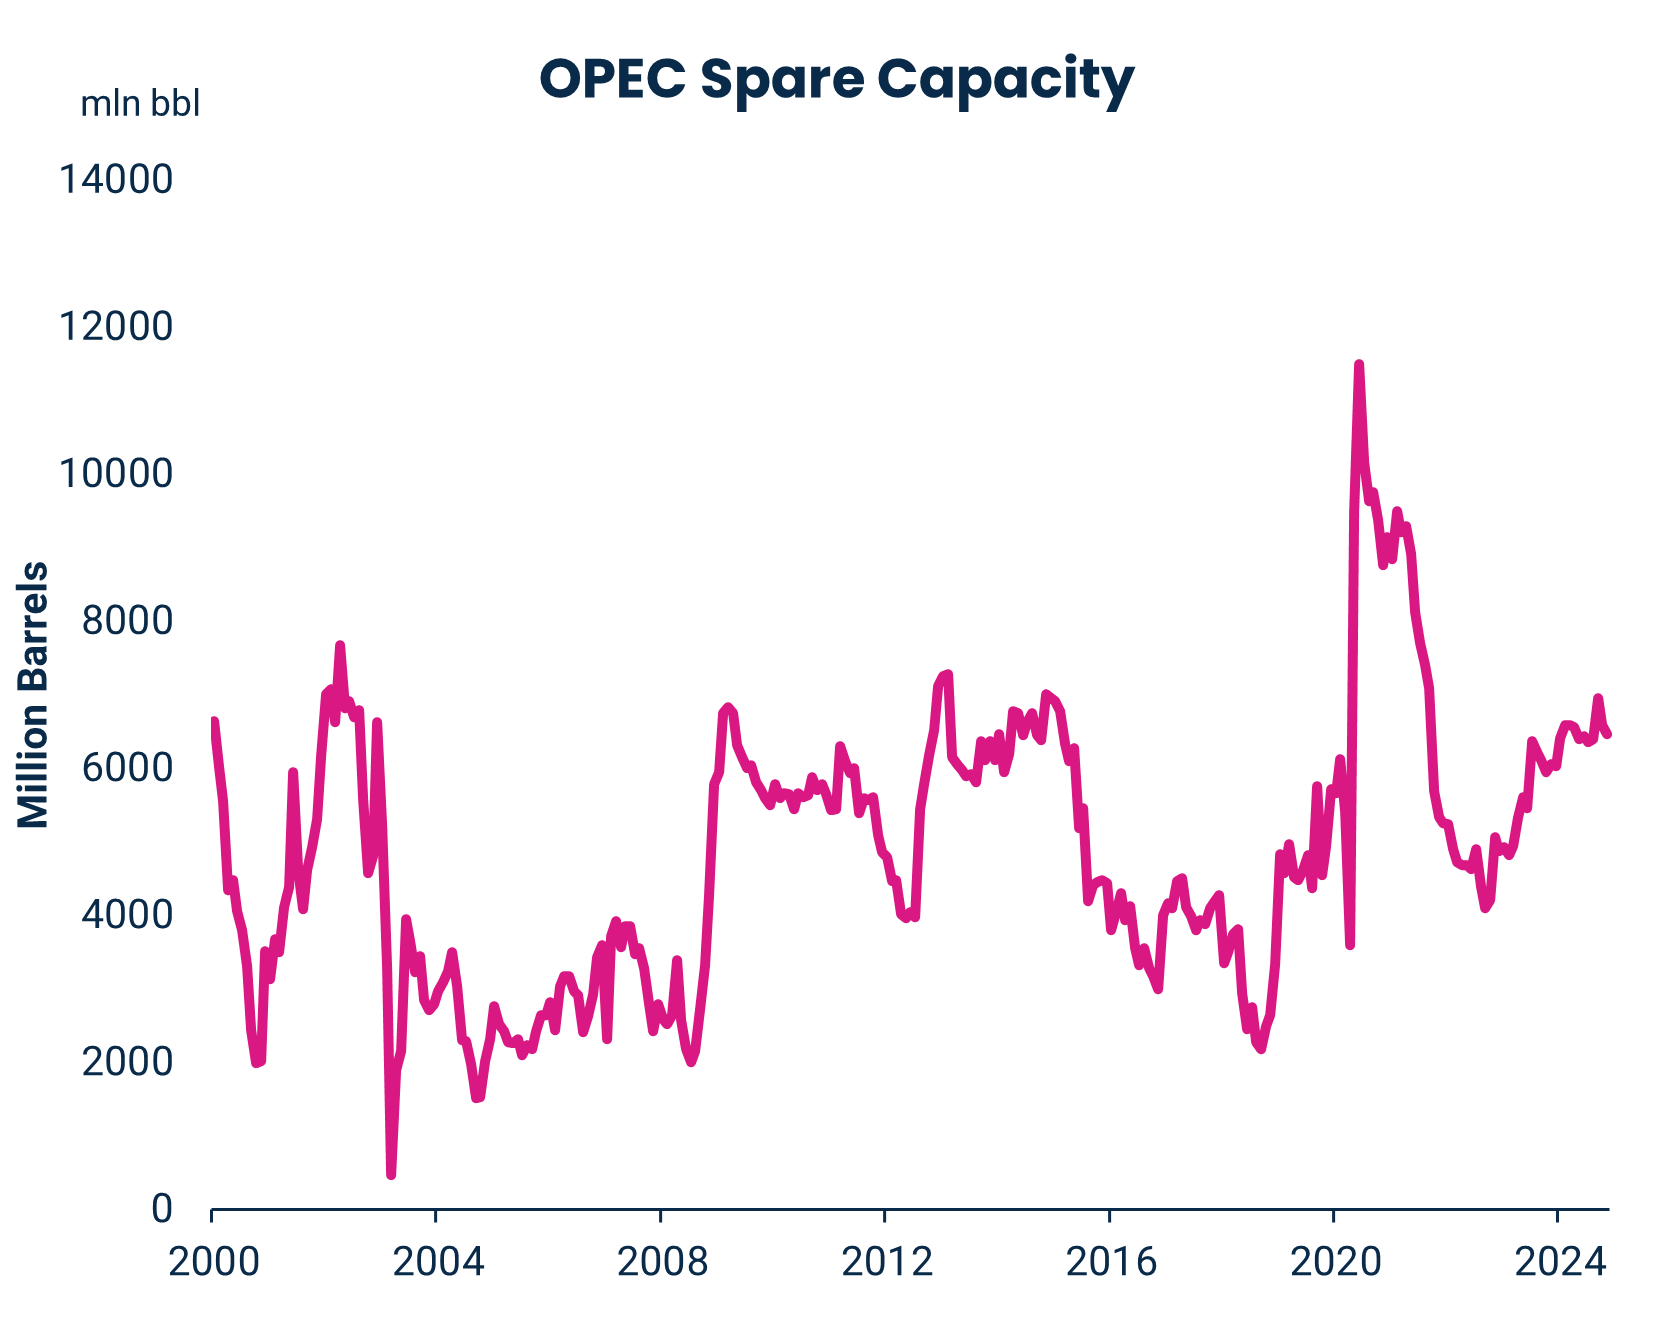
For more information about Harbor's indicators and models, please see the end of this document. For hypothetical and illustrative purposes only. This information should not be considered as a recommendation to purchase or sell a particular security. Sources: Harbor MAST, World Gold Council, Bloomberg, L.P. Data as of December 2024.
FX: Follow the Leader
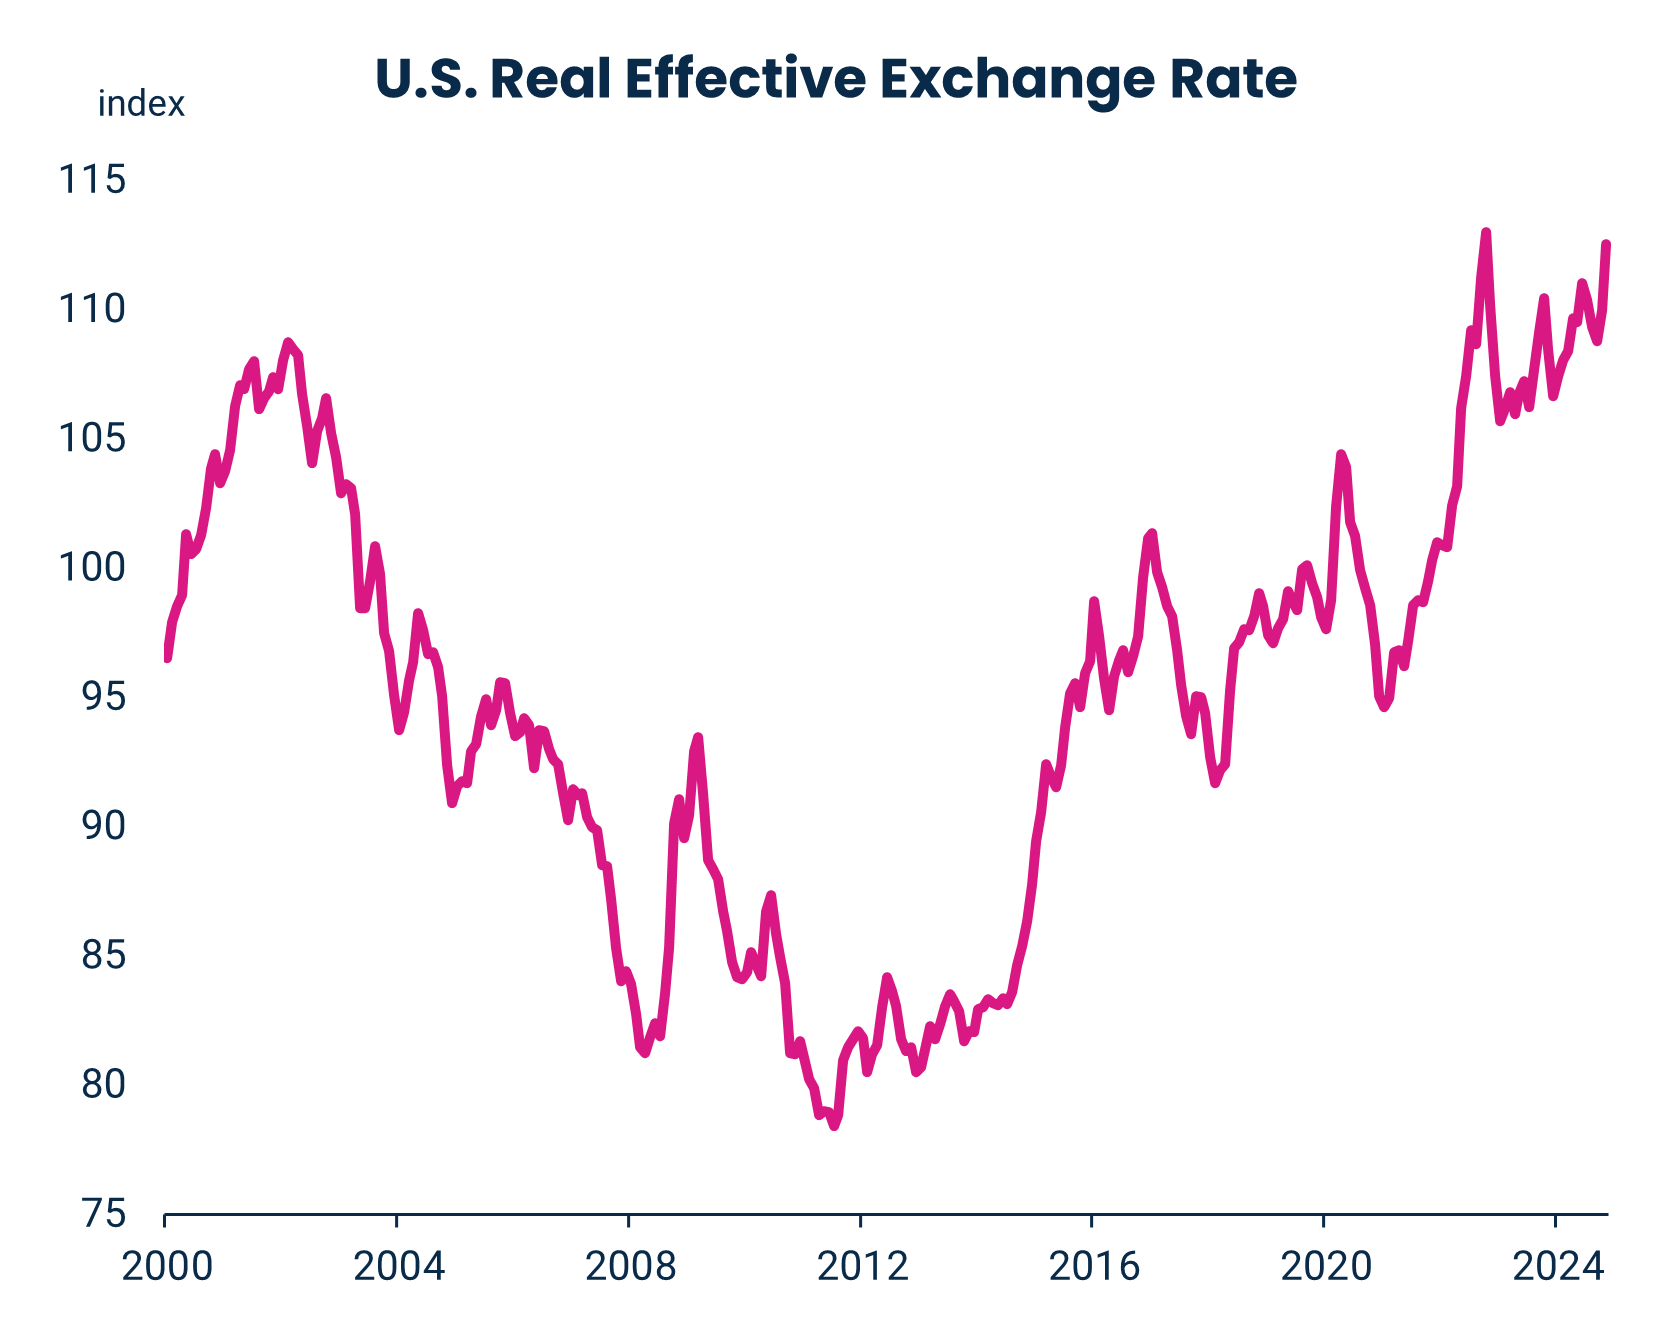
The strong growth and enthusiasm that powered the equity market’s gains benefitted the U.S. dollar as well, which appreciated 6.4 percent, the most since 2015 on a trade-weighted basis. The dollar finds itself at a similar starting point to equities for 2025 with a high valuation, arguably justified by superior fundamentals.
Where the dollar and equity comparison falls apart is on the policy outlook. The dollar stands to gain with higher tariffs given the U.S.’ large trade deficit, while risk sentiment likely suffers under the same conditions.
A simple prior for the U.S. dollar is that returns reflect a smile where the dollar performs best when risk sentiment and growth in the U.S. are at their best or worst.
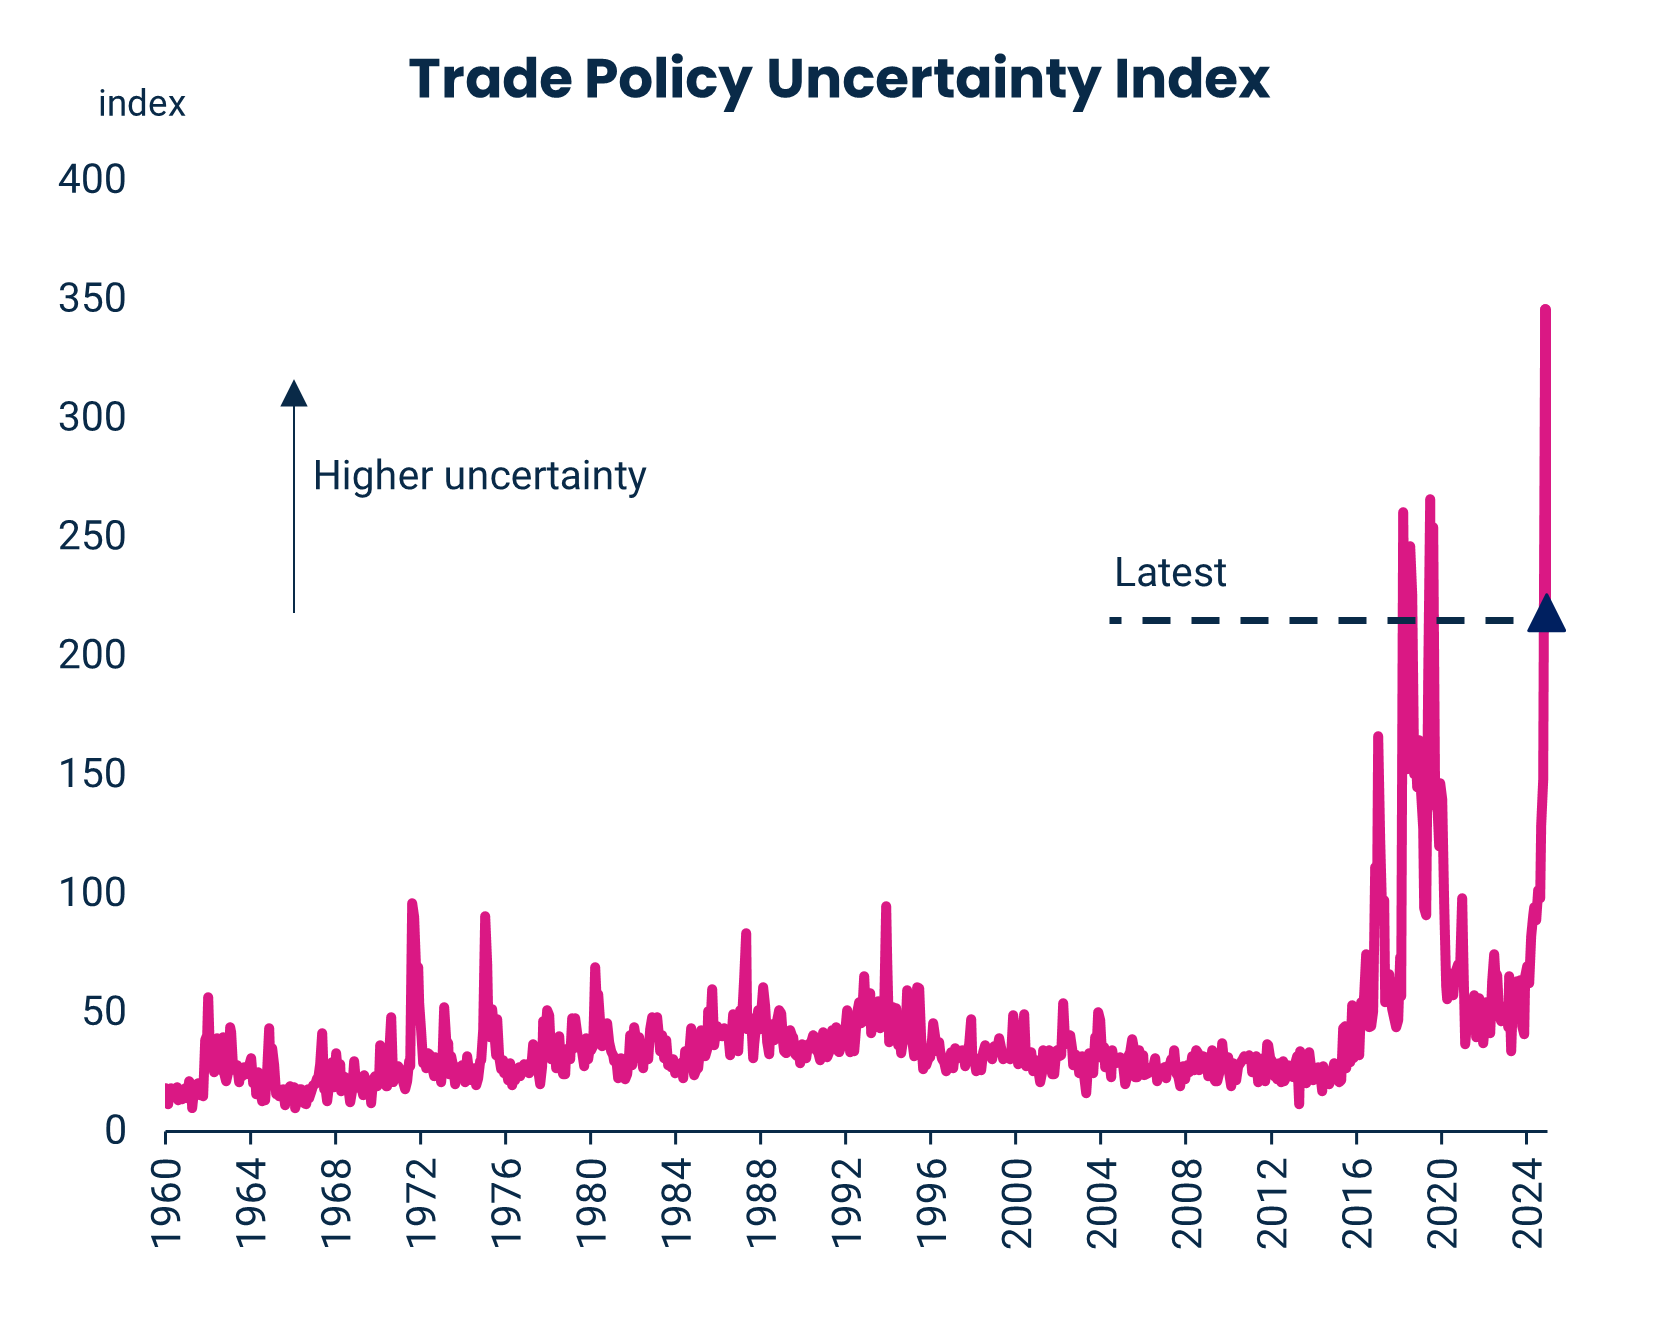
The risk is that the tariff assumptions prove optimistic and higher import duties stunt economic growth, particularly outside of the U.S. given most major economies heavier reliance on trade.
For more information about Harbor's indicators and models, please see the end of this document. For hypothetical and illustrative purposes only. This information should not be considered as a recommendation to purchase or sell a particular security. Sources: Harbor MAST; BIS; ; Bloomberg, L.P.; Caldara, Dario, Matteo Iacoviello, Patrick Molligo, Andrea Prestipino, and Andrea Raffo (2020), "The Economic Effects of Trade Policy Uncertainty," Journal of Monetary Economics, 109, pp.38-59. Data as of December 2024.
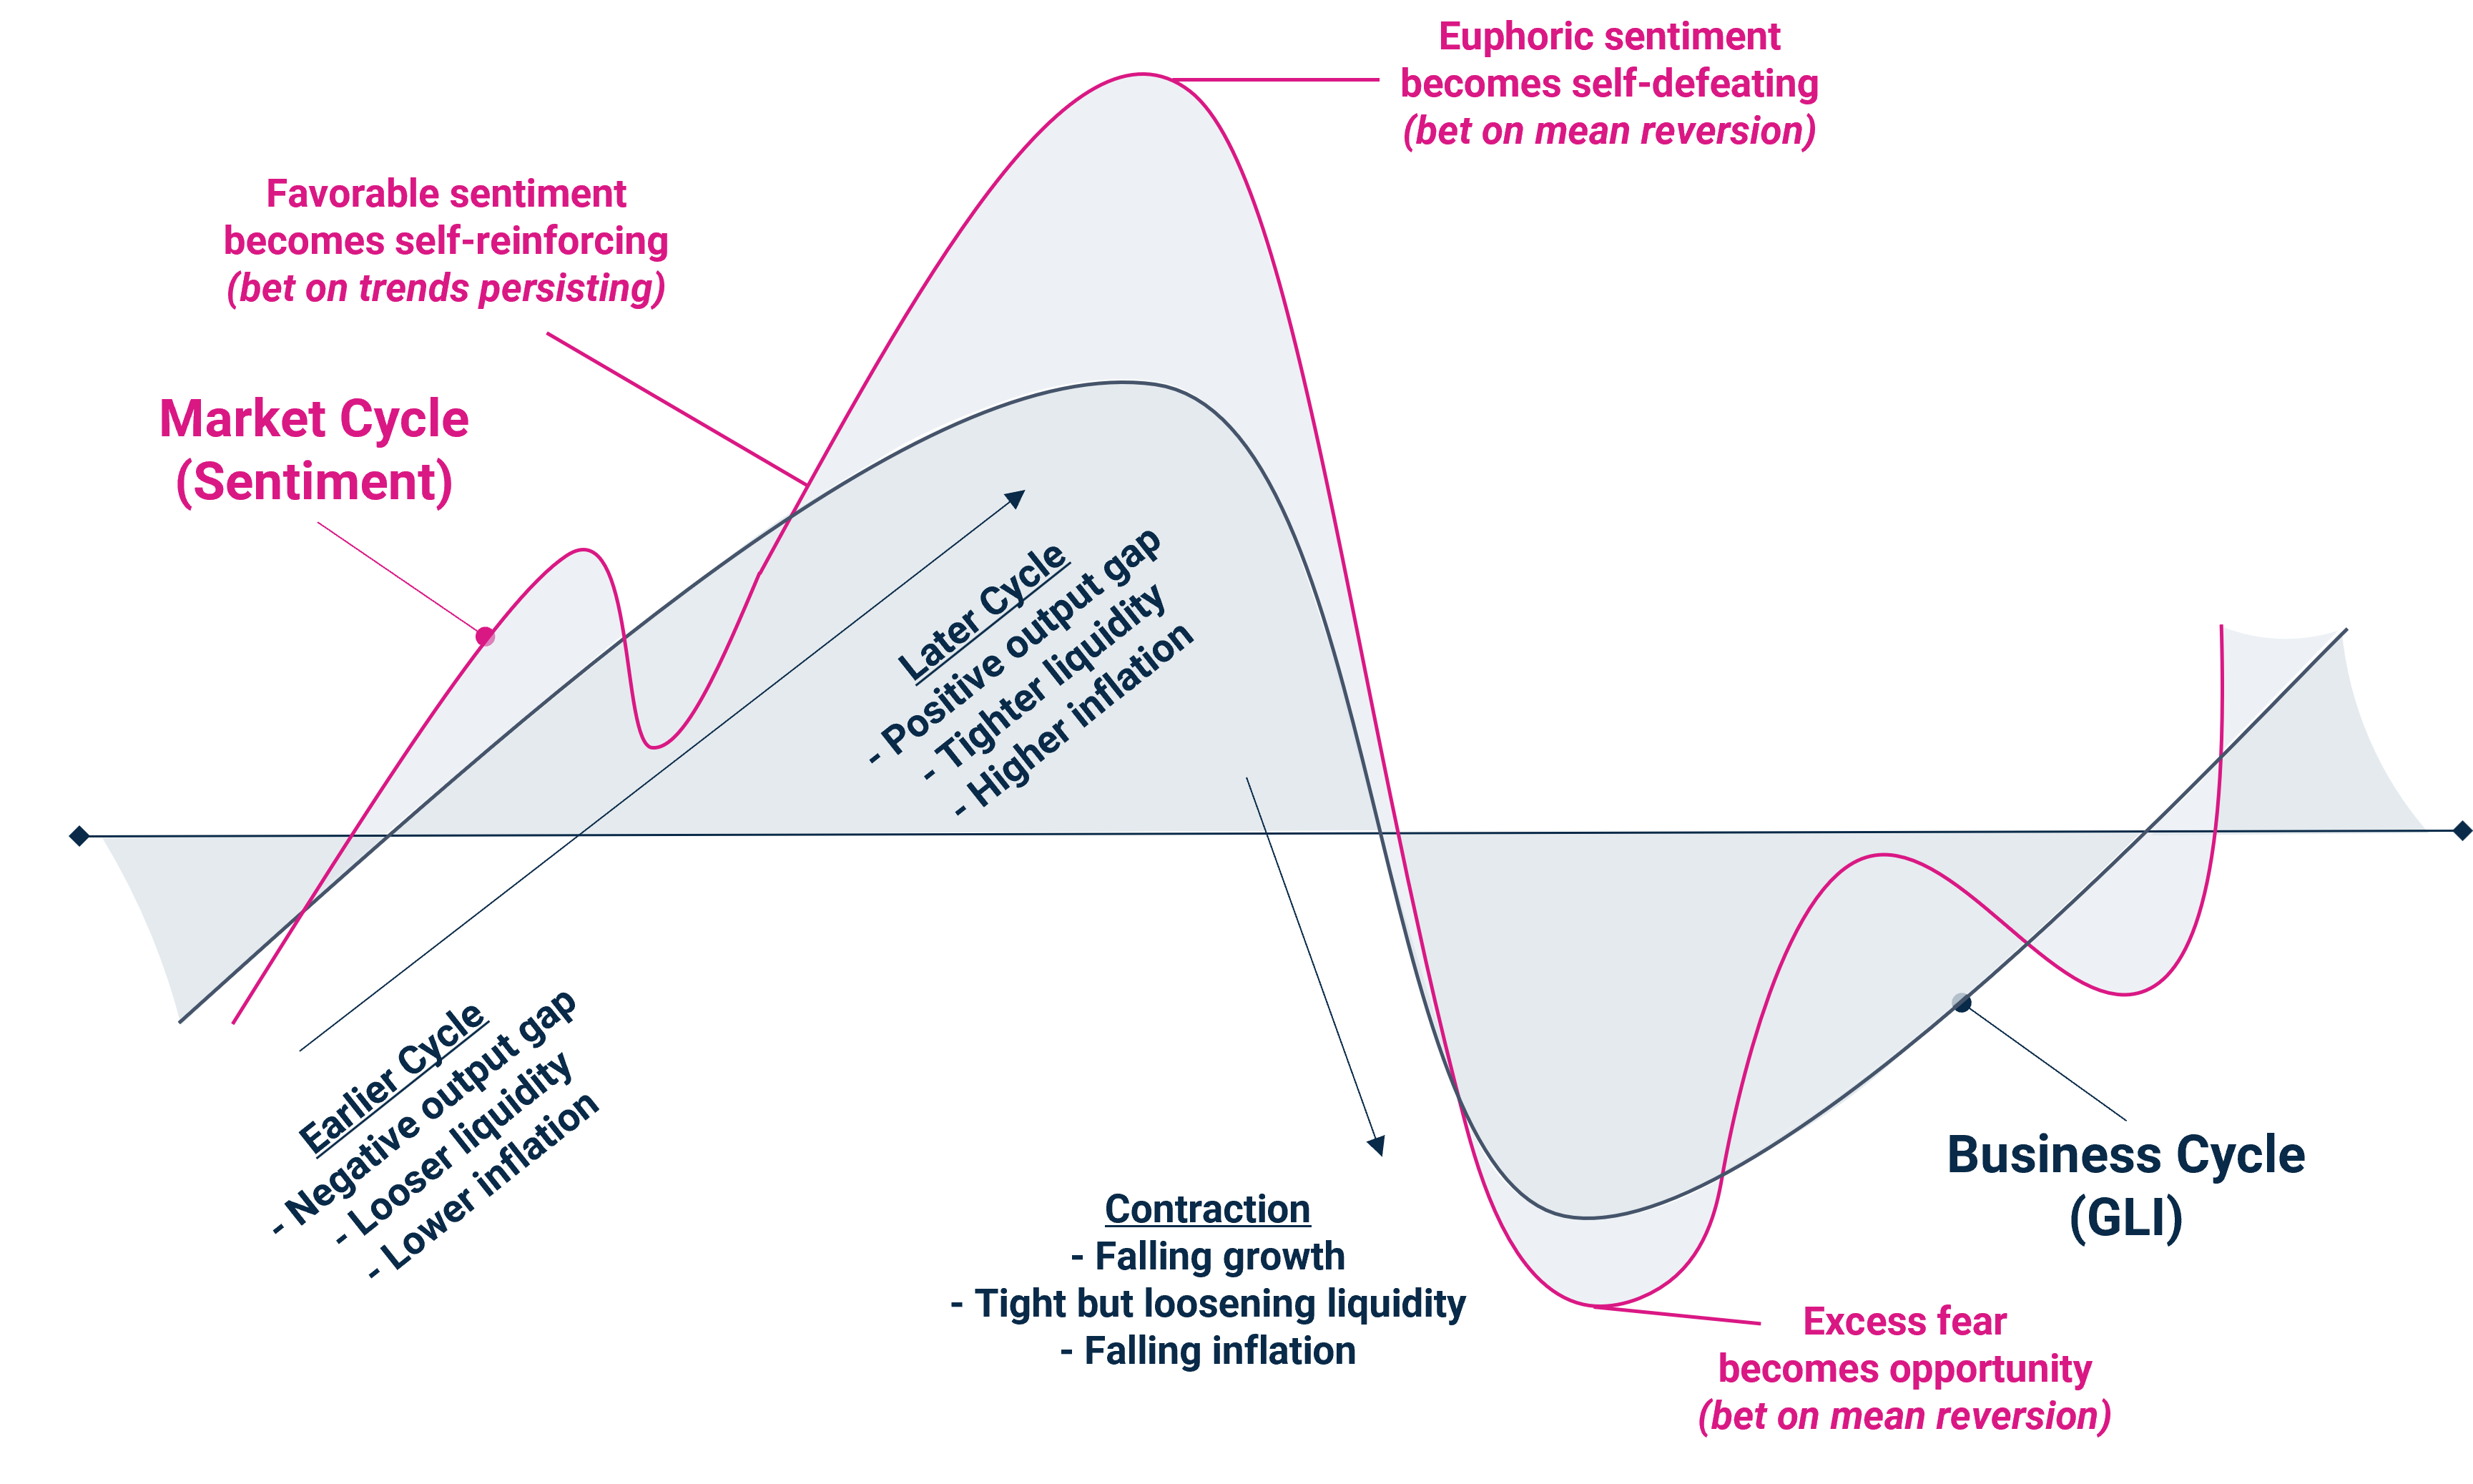
Regime Philosophy
We seek to model both fundamentals (business cycle) and the market’s perception of fundamentals (sentiment). We look at cross-asset market internals to suggest whether to follow trends or bet on mean reversion at extremes.
Five Regimes and Representative Characteristics
| Regime | Growth | Liquidity | Inflation | Sentiment |
| Early Cycle |
|
|
|
|
| Mid Cycle |
|
|
|
|
| Late Cycle Risk Seeking |
|
|
|
|
| Late Cycle Risk Averse |
|
|
|
|
| Contraction |
|
|
|
|
For more information about Harbor's indicators and models, please see the end of this document. For hypothetical and illustrative purposes only. Source: Harbor MAST.
Representative Positioning By Regime
Cross-Asset Positioning
| Regime | Equities | Credit | Bonds | Gold | Cash |
| Early Cycle | Strong Overweight | Strong Overweight | Strong Underweight | Neutral | Neutral |
| Mid Cycle | Overweight | Overweight | Overweight | Neutral | Underweight |
| Late Cycle Risk Seeking | Strong Overweight | Overweight | Underweight | Overweight | Neutral |
| Late Cycle Risk Averse | Underweight | Underweight | Overweight | Strong Overweight | Overweight |
| Contraction | Strong Underweight | Strong Underweight | Strong Overweight | Strong Overweight | Strong Overweight |
Intra-Equity Positioning
| Regime | Value Equities | Growth Equities | Low Vol Equities | Small Cap Equities | Large Cap Equities |
| Early Cycle | Strong Overweight | Neutral | Strong Underweight | Strong Overweight | Neutral |
| Mid Cycle | Neutral | Neutral | Overweight | Underweight | Overweight |
| Late Cycle Risk Seeking | Underweight | Strong Overweight | Strong Underweight | Underweight | Strong Overweight |
| Late Cycle Risk Averse | Strong Underweight | Strong Underweight | Strong Overweight | Strong Underweight | Overweight |
| Contraction | Strong Underweight | Strong Underweight | Strong Overweight | Strong Underweight | Overweight |
For more information about Harbor's indicators and models, please see the end of this document. For hypothetical and illustrative purposes only. This information should not be considered as a recommendation to purchase or sell a particular security. Source: Harbor MAST.
Important Information
The views expressed herein are those of the Harbor Multi Asset Solutions Team at the time the comments were made. They may not be reflective of their current opinions, are subject to change without prior notice, and should not be considered investment advice. These views are not necessarily those of the Harbor Investment Team and should not be construed as such. The information provided is for informational purposes only.
Past performance is no guarantee of future results.
All investments are subject to market risk, including the possible loss of principal. Stock prices can fall because of weakness in the broad market, a particular industry, or specific holdings. Bonds may decline in response to rising interest rates, a credit rating downgrade or failure of the issue to make timely payments of interest or principal. International investments can be riskier than U.S. investments due to the adverse affects of currency exchange rates, differences in market structure and liquidity, as well as specific country, regional, and economic developments. These risks are generally greater for investments in emerging markets.
Fixed income securities fluctuate in price in response to various factors, including changes in interest rates, changes in market conditions and issuer-specific events, and the value of an investment may go down. This means potential to lose money.
As interest rates rise, the values of fixed income securities are likely to decrease and reduce the value of a portfolio. Securities with longer durations tend to be more sensitive to changes in interest rates and are usually more volatile than securities with shorter durations. Interest rates in the U.S. are near historic lows, which may increase exposure to risks associated with rising rates. Additionally, rising interest rates may lead to increased redemptions, increased volatility and decreased liquidity in the fixed income markets.
Diversification does not assure a profit or protect against loss in a declining market. Indices listed are unmanaged, and unless otherwise noted, do not reflect fees and expenses and are not available for direct investment.
Investing entails risks and there can be no assurance that any investment will achieve profits or avoid incurring losses.
Certain forecasts, estimates and returns are based on hypothetical assumptions. It is for informational and hypothetical purposes only. This material does not constitute investment advice and should not be viewed as a current or past recommendation or a solicitation of an offer to buy or sell any securities or to adopt any investment strategy. The forecasts, estimates and return presented do not represent the results that any particular investor may actually attain. Actual performance results will differ, and may differ substantially, from the hypothetical information provided. There is no guarantee that any of the forecasts and projections will come to pass.
Performance indices on slide 3 are as follows: U.S. Large Cap, the S&P 500 Index; U.S. SMID Cap, the Russell 2500 Index; Western Europe, FTSE Developed Europe All Cap Net Tax Index; Japan, MSCI Japan Index; Emerging Markets, MSCI Emerging Markets Index; Treasuries, the Bloomberg U.S. Treasury Index; Municipals, the Bloomberg U.S. Municipals Index; IG Corp, the Bloomberg U.S. Corporate Bond Index; MBS, the Bloomberg U.S. Mortgage-backed Securities Index; ABS, the Bloomberg U.S. Agg ABS Index; Euro IG, the Bloomberg Euro-Aggregate Corporates Index; EMD ($), the Bloomberg Emerging Markets Hard Currency Aggregate Index; EM IG Corp, the Bloomberg Emerging Markets Investment Grade Index; Euro HY, the Bloomberg Pan-European High Yield Index; US HY, the Bloomberg U.S. Corporate High Yield Bond Index; Leveraged Loans, the Morningstar LSTA U.S. Leveraged Loan Index.
The Harbor Business Cycle Indicator is a proprietary Indicator used by the Multi-Asset Solutions Team to measure growth momentum by country/region. The Indicator utilizes a set of leading United States economic indicators that are standardized and then aggregated into a singular composite score. A higher (lower) score implies a higher (lower) level of growth.
The U.S. Manufacturing Index is a subcomponent of the Harbor Business Cycle Indicator. The team produces a Business Cycle Regime measurement using the business cycle indicator, liquidity cycle composite, fundamental recession probability model, and gauges of market internals. Business Cycle Indicator and Regime Sources: Bloomberg, Factset. The Business Cycle Indicator and Rate of Change Models assume that the historical relationship between the selected leading indicators and future economic growth remains stable. The growth and liquidity composites utilize a set of indicators that are standardized and then aggregated into a singular composite score. A higher (lower) score implies a higher (lower) level of growth and liquidity. The growth composite uses leading and concurrent economic signals to measure growth momentum. The liquidity composite measures prevailing conditions that we believe drive the Central Bank’s reaction function. A limiting factor for our modeling approach is if these relationships change, our models may be less accurate in measuring growth momentum.
The Harbor Liquidity Cycle Composite is a proprietary Indicator used by the Multi-Asset Solutions Team to measure the prevailing conditions that we believe drive the Central Bank’s reaction function. The Indicator utilizes a set of indicators that are standardized and then aggregated into a singular composite score. A higher (lower) score implies a higher (lower) level of liquidity. The input variables measure growth momentum, inflation, normalized equity market valuations, and levels of leverage across the private sector and consumer. Liquidity Cycle Composite Sources: Harbor MAST, Bloomberg, Institute of Supply Management, Federal Reserve, Bureau of Labor Statistics. The Liquidity Cycle Composite assumes that the historical relationship between the selected indicators and future liquidity conditions remain stable. A limiting factor for our modeling approach is if these relationships change, our models may be less accurate in terms of measuring the conditions that drive liquidity.
The Harbor Lending Index is a proprietary Indicator used by the Multi-Asset Solutions Team to measure bank lending conditions. The indicator uses a set of surveys and lending data that are standardized and then aggregated into a singular composite score. A higher (lower) score implies a higher (lower) level of bank lending. Sources: Bloomberg, Federal Reserve. The Harbor Lending Index assumes that the historical relationship between the selected indicators and lending remain stable
The Trend Inflation Composite is a proprietary Indicator used by the Multi-Asset Solutions Team to measure the prevailing conditions that we believe drive realized inflation. The Indicator utilizes a set of indicators that are standardized and then aggregated into a singular composite score. A higher (lower) score implies a higher (lower) level of realized inflation. The input variables measure wages, commodity prices, labor demand, and inflation data inputs. Trend Inflation Composite Sources: Harbor MAST, Bloomberg, Institute of Supply Management, Federal Reserve, Mortgage Bankers Association, U.S. Department of Commerce, Bureau of Labor Statistics.
The Market Sentiment Indicator is a proprietary Indicator used by the Multi-Asset Solutions Team to measure the prevailing conditions that we believe explain market sentiment. The input variables are predominantly market price variables that reflect price momentum across various styles and sectors within equities, credit, fixed income and commodities markets. Market Sentiment Indicator Sources: Harbor MAST, Bloomberg. A limiting factor for our modeling approach is if these relationships change, our models may be less accurate in terms of measuring the conditions that drive market sentiment.
The Growth Composite utilizes a set of indicators that are standardized and then aggregated into a singular composite score and uses leading and concurrent economic signals to measure growth momentum. A limiting factor for our modeling approach is if these relationships change, our models may be less accurate in measuring growth momentum.
4215767