 Contact
The Cost of Performance Chasing
September 08, 2023Execute Summary
Investors have a tendency to buy assets after periods of strong performance and sell them after periods of weakness1. This study quantifies the cost of this performance chasing behavior across various asset classes2 by examining the gap between dollar-weighted returns3 experienced by investors and time-weighted returns4 based on asset prices and distributions. Our key findings are:
Since 20065, performance chasing costs investors an annualized 92bps over rolling 5-year periods2 on average, ranging from 57bps for Intermediate Core-Plus Bond investors to 188bps for Mid Cap Equity investors.
For almost all asset classes, the toll on investor returns is typically more severe when market volatility is high.
Equity investors experience a wider performance gap over longer time periods. Commodities investors, and Fixed Income investors to a lesser extent, experience the opposite pattern. Commodities investors also incur the highest cost as a percentage of annualized market return among all asset classes.
Figure 1 Average Annualized Performance Gap2 by Asset Class and Time Window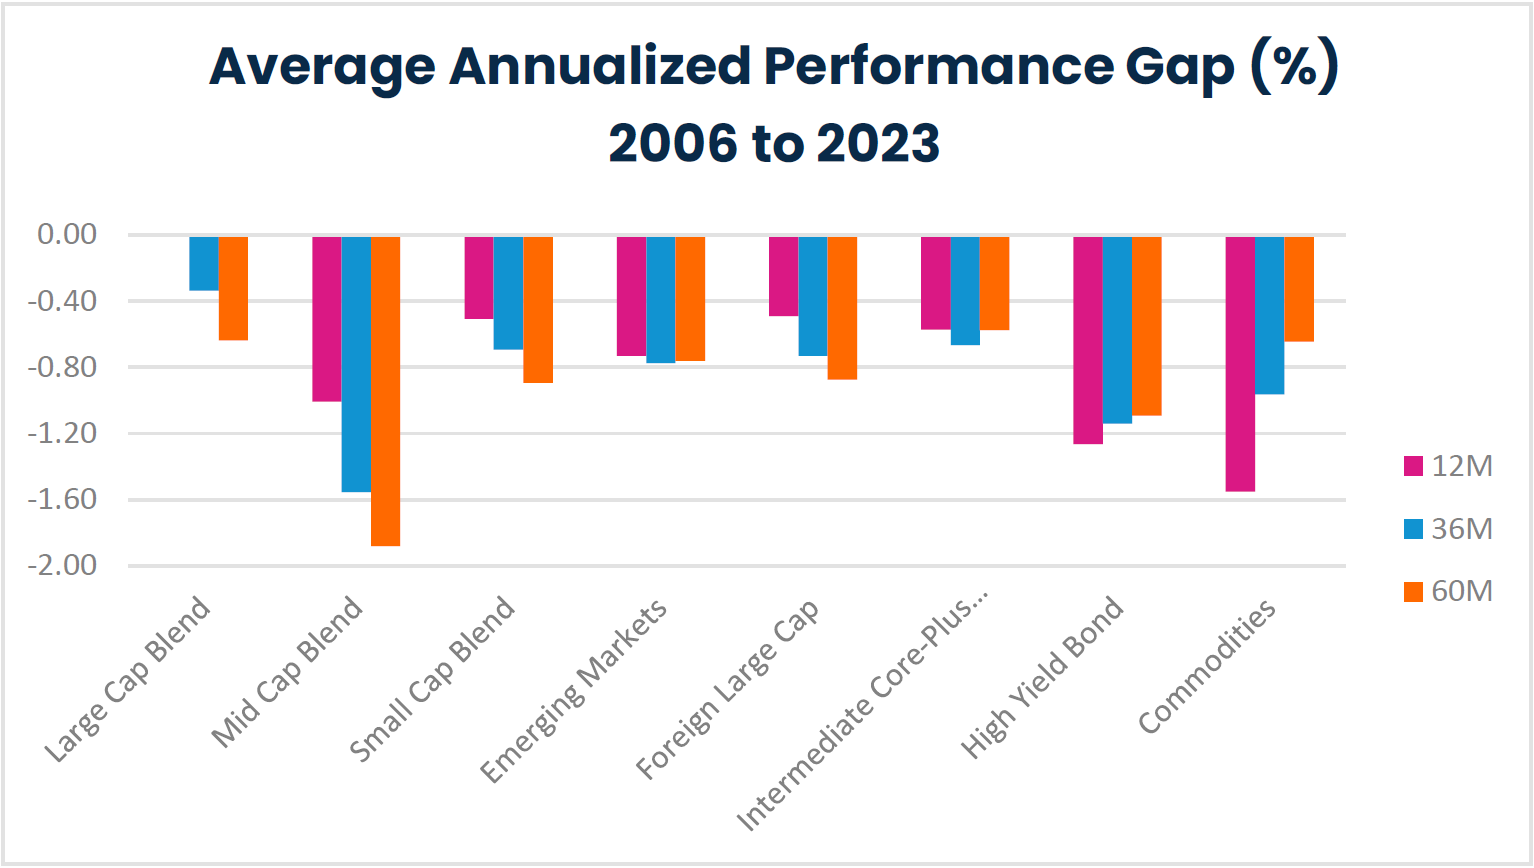
Source: Morningstar Direct, April 2023. Performance data shown represents past performance and is no guarantee of future results.
1Friesen and Sapp (2007), Grinblatt and Titman (1989).
2See Data and Methodology for detailed definition.
3Dollar-weighted return is the compounded rate of return that equalizes the present values of all cash flows over a specific period with the value of the initial investment.
4Time-weighted return is the compounded rate of return based on periodic returns of an investment over a specific period.
5The starting point of 2006 was chosen as it was the earliest starting date that the latest asset class (commodities) had enough coverage for inclusion in the chart.
Performance Gap
Investors typically use time-weighted returns to measure an asset’s rate of return over a given time period, which is consistent with the return of a buy-and-hold strategy. However, each investor experiences a different wealth trajectory as they choose to buy or sell the asset at different points in time throughout the period. The difference between the dollar-weighted return achieved by the investor and the time-weighted return reflects the impact of an investor’s trading behavior on their cumulated wealth. As investors chase recent winners and money flows to assets that subsequently fail to outperform, this difference, or performance gap, tends to be negative.
We measure the performance gap across various asset classes and confirm it is indeed negative for all asset classes over both short and long term (Table 1). On a rolling 60-month basis, for example, the performance chasing behavior costs Large Cap Blend equities investors an annualized 64bps on average relative to a buy-and-hold strategy. The cost ranges from 57bps for Intermediate Core-Plus Bond investors to 188bps for Mid Cap investors, and averages 92bps across all asset classes. The hit rate6 of performance gap, which measures the percentage of months when the performance gap is positive, is meaningfully below 50% for most asset classes. This suggests that more often than not, investors’ timing decisions detract from their returns.
| Large Cap Blend | Mid Cap Blend | Small Cap Blend | Emerging Markets | Foreign Large Cap | Intermediate Core-Plus Bond | High Yield Bond | Commodities | |
|---|---|---|---|---|---|---|---|---|
| 12M | ||||||||
| Average Performance Gap | 0.00 | -1.01 | -0.51 | -0.73 | -0.49 | -0.57 | -1.27 | -1.55 |
| Median Performance Gap | -0.28 | -0.95 | -0.72 | -0.45 | -0.48 | -0.57 | -1.42 | -1.20 |
| Performance Gap Hit Rate | 0.35 | 0.17 | 0.21 | 0.10 | 0.19 | 0.07 | 0.06 | 0.18 |
| 36M | ||||||||
| Average Performance Gap | -0.34 | -1.55 | -0.69 | -0.77 | -0.73 | -0.67 | -1.14 | -0.96 |
| Median Performance Gap | -0.32 | -1.22 | -0.85 | -0.75 | -0.55 | -0.62 | -1.29 | -0.60 |
| Performance Gap Hit Rate | 0.33 | 0.18 | 0.29 | 0.16 | 0.24 | 0.00 | 0.03 | 0.45 |
| 60M | ||||||||
| Average Performance Gap | -0.64 | -1.88 | -0.89 | -0.76 | -0.87 | -0.57 | -1.09 | -0.64 |
| Median Performance Gap | -0.48 | -1.69 | -1.00 | -0.58 | -0.58 | -0.49 | -1.15 | -0.40 |
| Performance Gap Hit Rate | 0.13 | 0.11 | 0.11 | 0.08 | 0.07 | 0.03 | 0.00 | 0.38 |
Source: Morningstar Direct, April 2023. Performance data shown represents past performance and is no guarantee of future results.
To provide context on the magnitude of the cost of performance chasing, we scale the average performance gap by the absolute value of annualized market returns (Table 2). On a rolling 60-month basis, the performance chasing behavior costs investors 16% of their returns across various asset classes. Commodities investors by far suffer the most over both short and long horizons given the asset class’s low buy-and-hold returns to begin with.
6Hit rate is the percentage of time when excess return is positive.
| Large Cap Blend | Mid Cap Blend | Small Cap Blend | Emerging Markets | Foreign Large Cap | Intermediate Core-Plus Bond | High Yield Bond | Commodities | |
|---|---|---|---|---|---|---|---|---|
| 12M | ||||||||
| Average Annualized Market Return | 9.65 | 8.93 | 8.98 | 6.76 | 5.58 | 3.96 | 5.79 | 2.14 |
| Performance Gap / Market Return | -0.04% | -11.28% | -5.64% | -10.82% | -8.77% | -14.47% | -21.85% | -72.60% |
| 36M | ||||||||
| Average Annualized Market Return | 9.19 | 8.00 | 7.96 | 3.97 | 4.06 | 4.54 | 5.91 | -1.96 |
| Performance Gap / Market Return | -3.67% | -19.44% | -8.71% | -19.53% | -18.01% | -14.69% | -19.28% | -49.08% |
| 60M | ||||||||
| Average Annualized Market Return | 10.14 | 9.02 | 8.86 | 4.18 | 4.64 | 4.42 | 6.36 | -2.45 |
| Performance Gap / Market Return | -6.27% | -20.86% | -10.08% | -18.17% | -18.83% | -13.00% | -17.16% | -26.31% |
Source: Morningstar Direct, April 2023. Performance data shown represents past performance and is no guarantee of future results.
Figure 1 and Figure 2 present the same information as in Table 1 and further reveal that for most Equity investors, the cost of performance chasing becomes more pronounced as the time horizon increases. Conversely, for Commodities investors, and to a lesser extent Fixed Income investors, the opposite is true. Commodities investors experience the widest performance gap over rolling 12-month windows and the narrowest over 60-month windows. Hit rates show similar patterns.
Figure 2 Median and Hit Rate of Performance Gap by Asset Class and Time Window – 2006 to 2023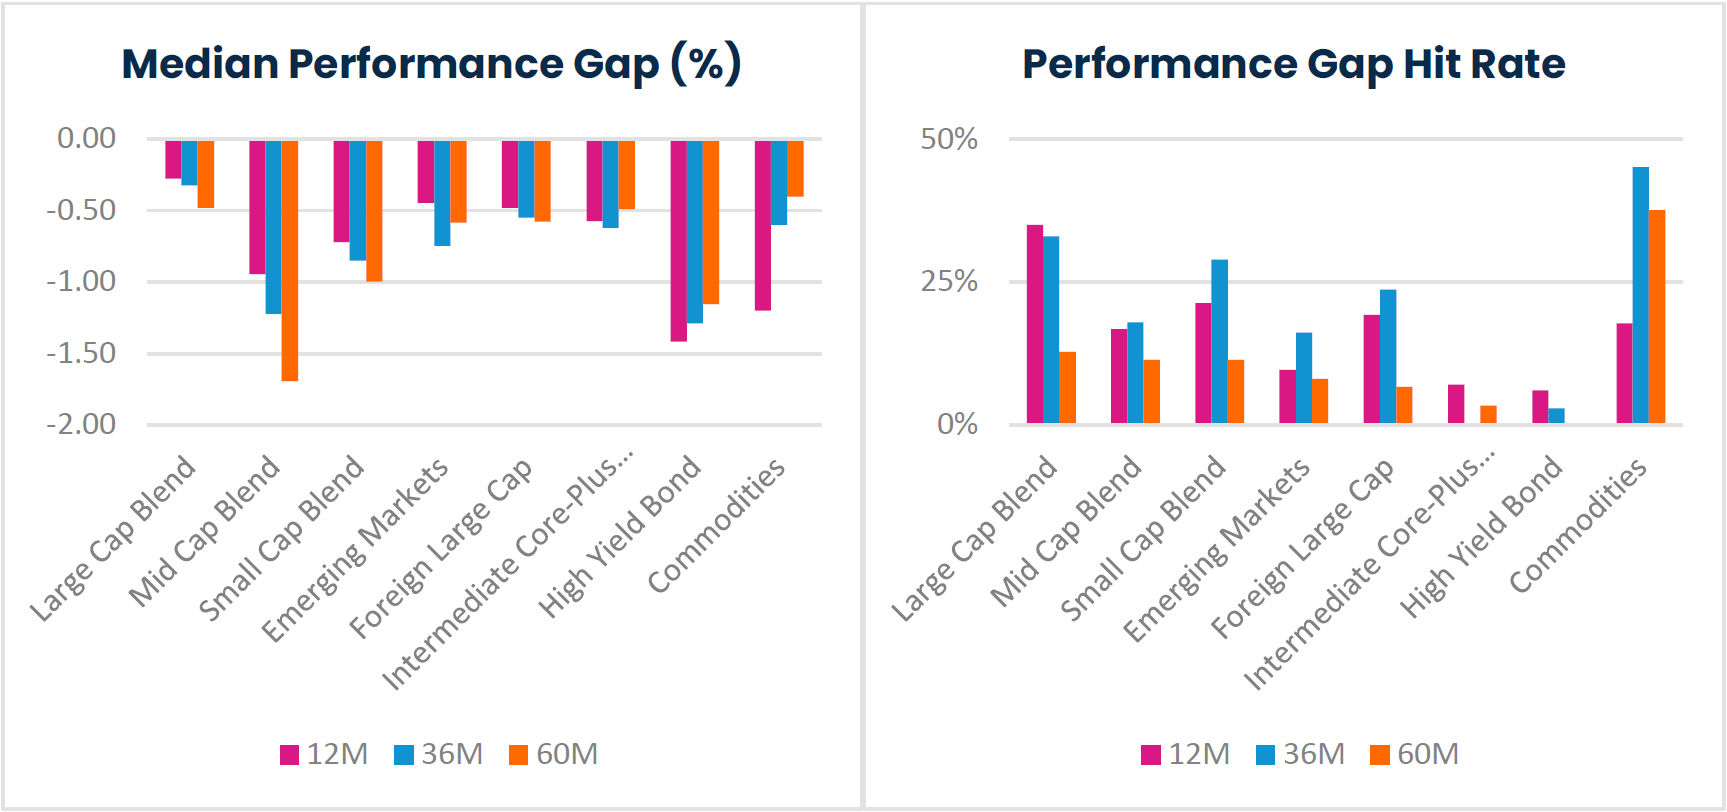
Source: Morningstar Direct, April 2023. Performance data shown represents past performance and is no guarantee of future results.
Performance Gap and Market Volatility
To understand the impact of market environment on the cost of investors’ performance chasing behavior, we examine the performance gap at different market volatility levels. A volatile market could not only increase the probability of investors’ timing errors as assets oscillate between gains and losses, but also magnify losses in the presence of poor timing skills, and therefore leads to a wider performance gap.
We rank all months into quintiles based on the rolling standard deviation7 of daily index returns8 and measure the average performance gap for each quintile9. Figure 3, Figure 4 and Figure 5 summarize the results for rolling 1-year, 3-year and 5-year windows, respectively. For almost all asset classes across different time windows, high market volatility is associated with a wide and negative performance gap, suggesting that the cost of performance chasing is particularly high in volatile market environments. Commodities is again an exception here. For 3-year and 5-year horizons, Commodities investors actually achieve a slightly positive performance gap, that is, a higher dollar-weighted return than the time-weighted return on average during both high and low volatility periods. High Yield Bond is another asset class that is different – market volatility doesn’t seem to have a meaningful impact on the performance gap.
Figure 3 Average 12-Month Performance Gap by Market Volatility Quintiles – 2006 to 2023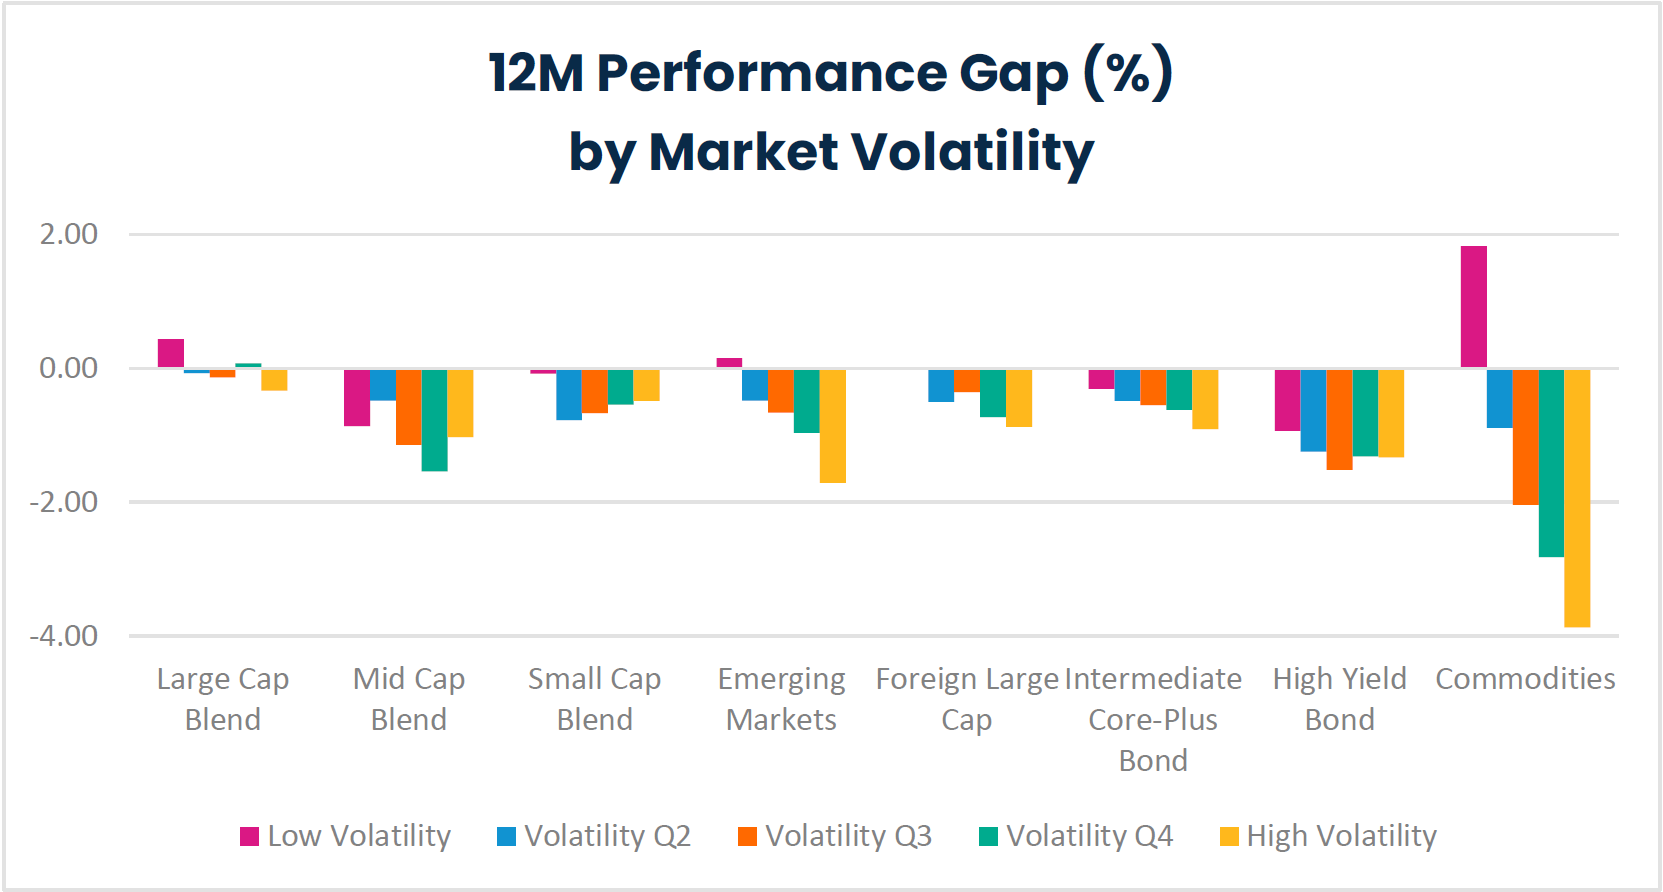
Source: Morningstar Direct & FactSet Research Systems, April 2023. Performance data shown represents past performance and is no guarantee of future results.
7Standard deviation is a statistic that measures the dispersion of a dataset relative to its mean and is calculated as the square root of the variance.
8Respective index returns references the following index per asset class: For Large Cap Blend – Russell 1000 Index, for Mid Cap Blend – Russell Midcap Index, for Small Cap Blend – Russell 2000 Index, for Emerging Markets – MSCI Emerging Markets Index, for Foreign Large Cap – MSCI EAFE Index, for Intermediate Core-Plus Bond – Bloomberg US Aggregate Index, for High Yield Bond – BofA US High Yield Index, for Commodities – Bloomberg Commodity Index.
9Quintile is any of five equal groups into which a population can be divided according to the distribution of values of a particular variable.
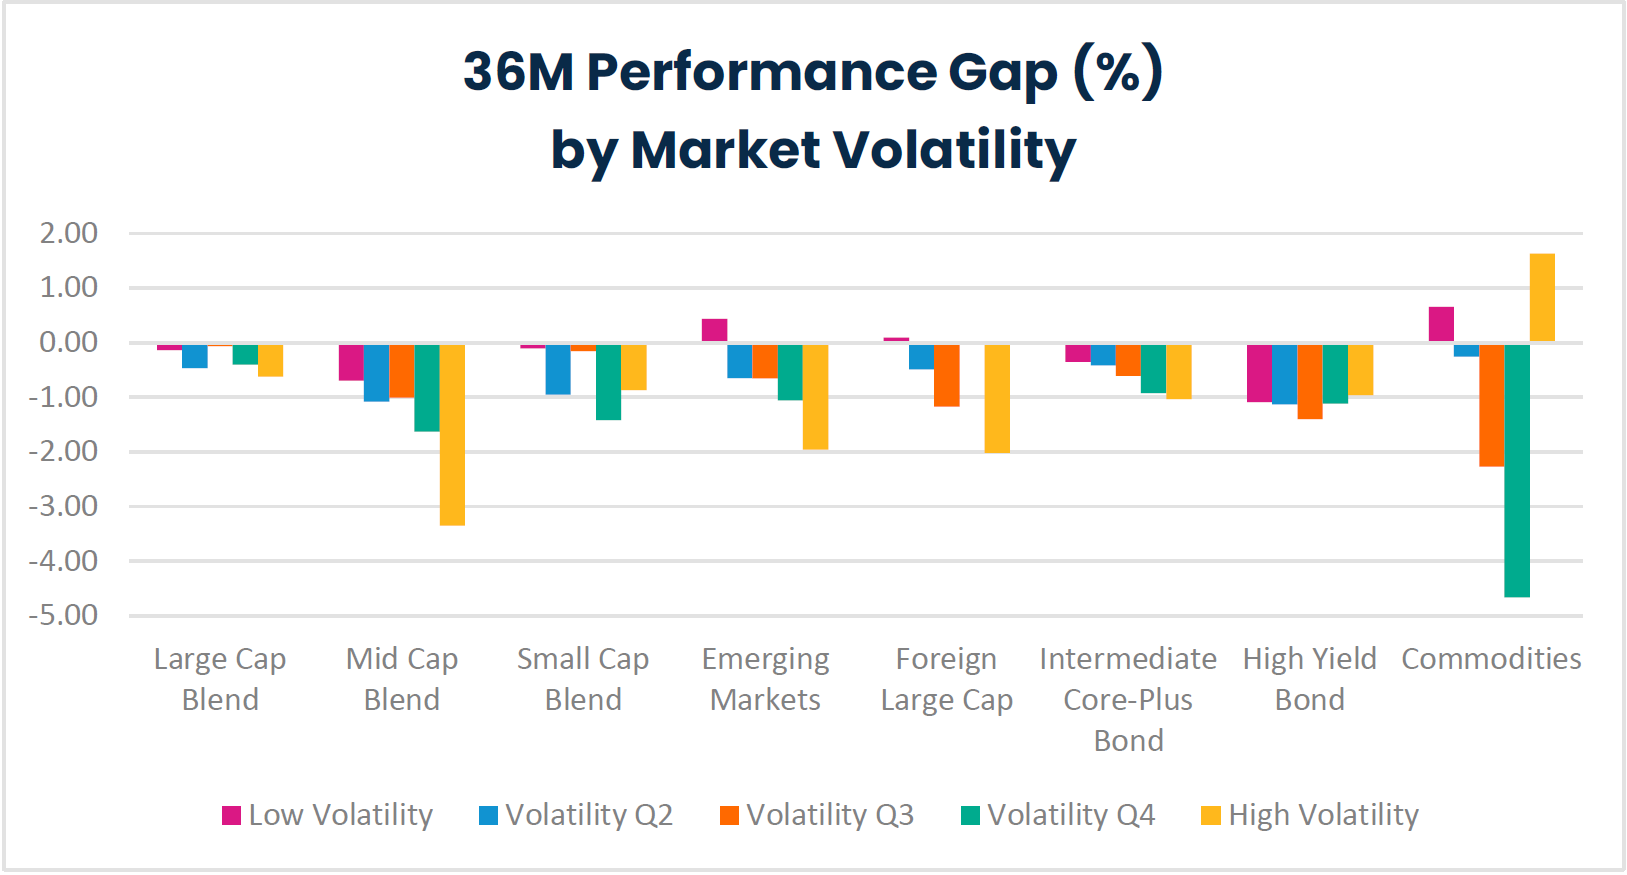
Source: Morningstar Direct & FactSet Research Systems, April 2023. Performance data shown represents past performance and is no guarantee of future results.
Figure 5 Average 60-Month Performance Gap by Market Volatility Quintiles – 2006 to 2023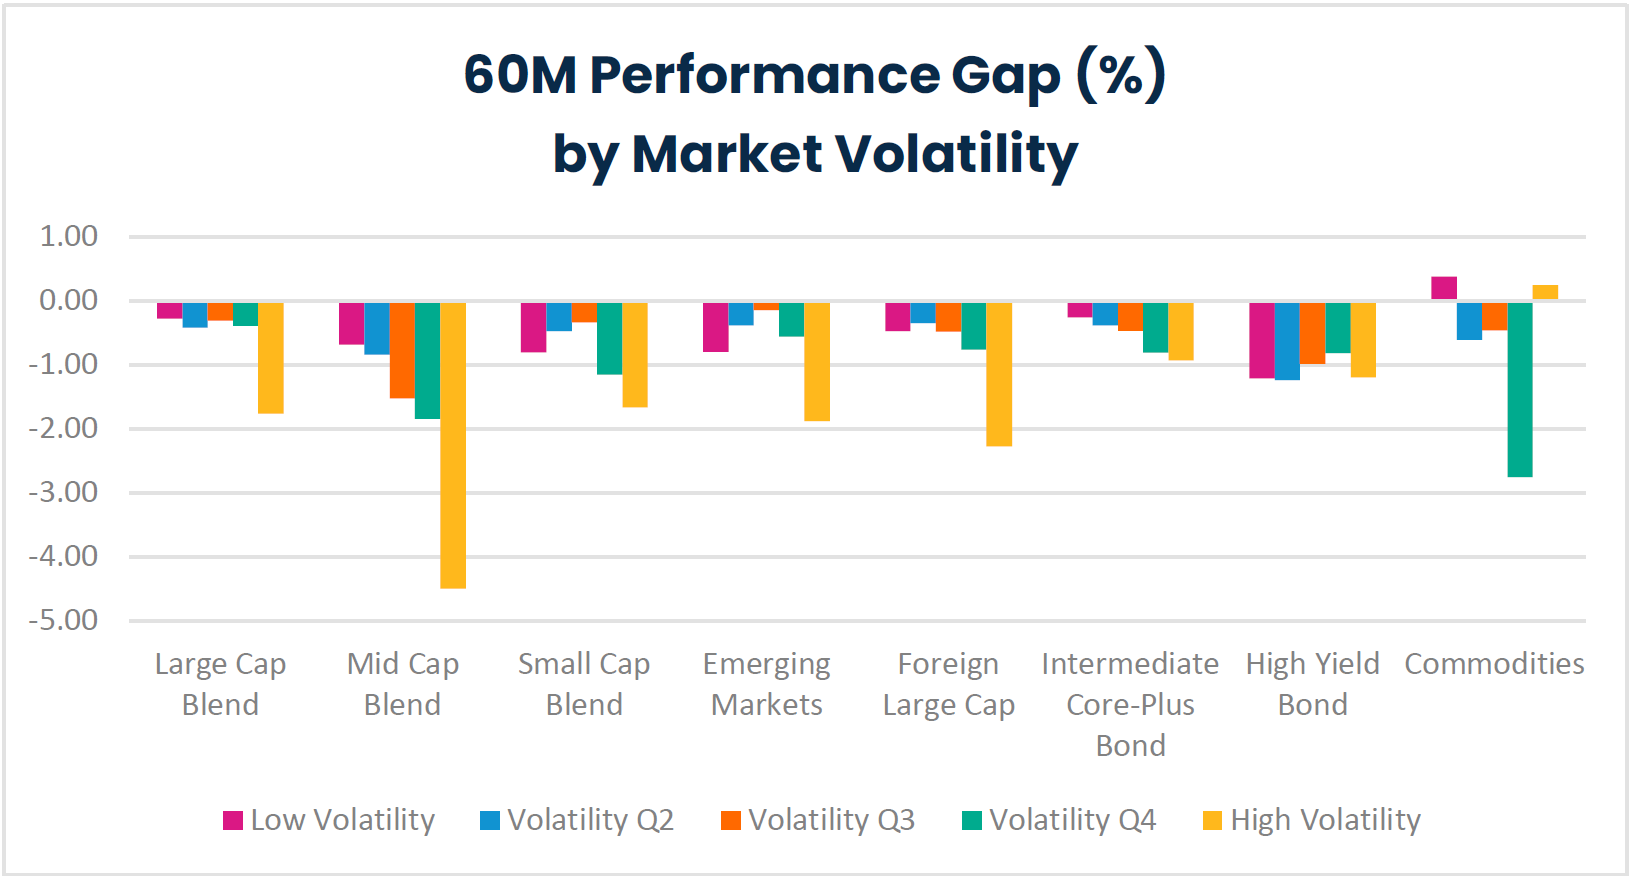
Source: Morningstar Direct & FactSet Research Systems, April 2023. Performance data shown represents past performance and is no guarantee of future results.
Conclusion
This study seeks to quantify the detrimental impact of performance chasing on investor returns across various asset classes. Using the difference between dollar-weighted returns experienced by investors and time-weighted returns, we document a consistently negative performance gap across all asset classes analyzed since 2006. The performance gap tends to widen during periods of higher market volatility, suggesting that investors are particularly susceptible to making suboptimal timing decisions during uncertain market conditions.
Commodities stand out as a unique asset class in this analysis. Performance chasing is particularly costly for Commodities investors when the performance gap is measured as a percentage of the buy and-hold return. We also find that the performance gap widens to a greater extent when considering shorter time windows, while the opposite is true for most Equity investors.
Data and Methodology
We used Morningstar data for actively managed open-end mutual funds and ETFs, and FactSet for index returns. For each share class of each fund, we obtained monthly flow, net assets and total returns from January 2006 to April 2023.
We consider active strategies to include Morningstar U.S. Large Blend category Funds (between the years 2006 and April of 2023, an average of 1114 funds were included), U.S. Mid Cap Blend Category Funds (between the years 2006 and April of 2023, an average of 283 funds were included), Emerging Markets Category Funds (between the years 2006 and April of 2023, an average of 550 funds were included), Foreign Large Cap Category Funds (between the years 2006 and April of 2023, an average of 1219 funds were included), Intermediate Core-Plus Bond Category Funds (between the years 2006 and April of 2023, an average of 451 funds were included), High Yield Bond Category Funds (between the years 2006 and April of 2023, an average of 563 funds were included), and Commodities Category Funds (between the years 2006 and April of 2023, an average of 80 funds were included).
Performance gap for each share class was calculated as the difference between 1) the share class’s annualized dollar-weighted return over a given time period using monthly flows and beginning and ending net assets, and 2) its annualized total return over the same period. As the dollar-weighted return is an internal rate of return (IRR) calculation which could potentially have multiple solutions, we chose the one that is the closest to 0. We also excluded monthly IRRs that are less than -100% or greater than 10000%.
The share class level performance gap was aggregated to the asset class level using an asset-weighted average where weights are proportionate to the beginning net assets of each share class.
Reference
- Friesen, G. C., & Sapp, S. G. (2007). Mutual fund flows and investor returns: An empirical examination of fund investor timing ability. Journal of Banking & Finance, 31(9), 2796-2816.
- Grinblatt, M., & Titman, S. (1989). Mutual fund performance: An analysis of quarterly portfolio holdings. Journal of Business, 62(3), 393-416.
Important Information
Performance data shown represents past performance and is no guarantee of future results.
For Institutional Use Only. Not for Distribution to the Public.
The views expressed herein are those of Harbor Capital Advisors, Inc. investment professionals at the time the comments were made. They may not be reflective of their current opinions, are subject to change without prior notice, and should not be considered investment advice. The information provided in this presentation is for informational purposes only.
This material does not constitute investment advice and should not be viewed as a current or past recommendation or a solicitation of an offer to buy or sell any securities or to adopt any investment strategy.
Investing entails risks and there can be no assurance that any investment will achieve profits or avoid incurring losses. Stock markets are volatile and equity values can decline significantly in response to adverse issuer, political, regulatory, market and economic conditions. Investing in international and emerging markets poses special risks, including potentially greater price volatility due to social, political and economic factors, as well as currency exchange rate fluctuations. These risks are more severe for securities of issuers in emerging market regions. Stocks of small cap companies pose special risks, including possible illiquidity and greater price volatility than stocks of larger, more established companies. The value of commodities investments will generally be affected by overall market movements and factors specific to a particular industry or commodity including weather, embargoes, tariffs, or health, political, international and regulatory developments. Fixed income investments are affected by interest rate changes and the creditworthiness.
HYPOTHETICAL PERFORMANCE RESULTS HAVE MANY INHERENT LIMITATIONS, SOME OF WHICH ARE DESCRIBED BELOW. NO REPRESENTATION IS BEING MADE THAT ANY ACCOUNT WILL OR IS LIKELY TO ACHIEVE PROFITS OR LOSSES SIMILAR TO THOSE SHOWN. IN FACT, THERE ARE FREQUENTLY SHARP DIFFERENCES BETWEEN HYPOTHETICAL PERFORMANCE RESULTS AND THE ACTUAL RESULTS SUBSEQUENTLY ACHIEVED BY ANY PARTICULAR TRADING PROGRAM.
ONE OF THE LIMITATIONS OF HYPOTHETICAL PERFORMANCE RESULTS IS THAT THEY ARE GENERALLY PREPARED WITH THE BENEFIT OF HINDSIGHT. INADDITION, HYPOTHETICAL TRADING DOES NOT INVOLVE FINANCIAL RISK, AND NO HYPOTHETICAL TRADING RECORD CAN COMPLETELY ACCOUNT FOR THE IMPACT OF FINANCIAL RISK IN ACTUAL TRADING.FOR EXAMPLE, THE ABILITY TO WITHSTAND LOSSES OR TO ADHERE TO A PARTICULAR TRADING PROGRAM IN SPITE OF TRADING LOSSES ARE MATERIAL POINTS WHICH CAN ALSO ADVERSELY AFFECT ACTUAL TRADING RESULTS. THERE ARE NUMEROUS OTHER FACTORS RELATED TO THE MARKETS IN GENERAL OR TO THE IMPLEMENTATION OF ANY SPECIFIC TRADING PROGRAM WHICH CANNOT BE FULLY ACCOUNTED FOR IN THE PREPARATION OF HYPOTHETICAL PERFORMANCE RESULTS AND ALL OF WHICH CAN ADVERSELY AFFECT ACTUAL TRADING RESULTS.
Historical performance data starts from January 2006 to April 2023 for all asset classes listed.
Harbor Capital Advisors, Inc.
3111207


